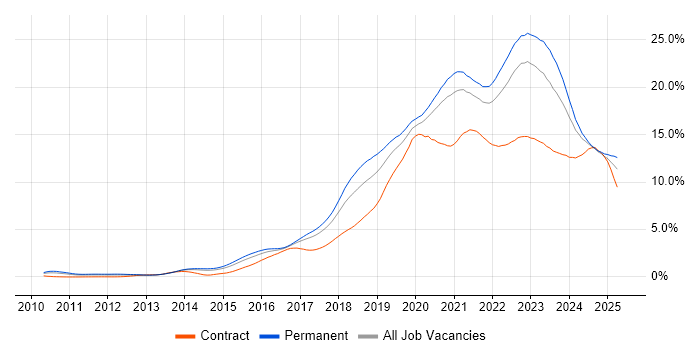
Azure Contract Job Trends in Yorkshire

Microsoft Azure
England > Yorkshire

The table below provides summary statistics and contractor rates for jobs advertised in Yorkshire requiring Azure skills. It covers vacancies from the 6 months leading up to 15 September 2025, with comparisons to the same periods in the previous two years.

6 months to
15 Sep 2025
Same period 2024 Same period 2023
Rank 12 7 8
Rank change year-on-year -5 +1 -2
Contract jobs citing Azure 181 199 275
As % of all contract jobs advertised in Yorkshire 11.94% 13.32% 13.23%
As % of the Cloud Services category 32.09% 38.12% 41.86%
Number of daily rates quoted 113 139 215
10th Percentile £313 £373 £363
25th Percentile £378 £438 £450
Median daily rate (50th Percentile) £475 £507 £550
Median % change year-on-year -6.31% -7.82% +4.76%
75th Percentile £544 £608 £650
90th Percentile £632 £650 £700
England median daily rate £525 £538 £550
% change year-on-year -2.33% -2.27% -2.22%
Number of hourly rates quoted 0 0 1
10th Percentile - - -
25th Percentile - - £41.50
Median hourly rate - - £43.00
75th Percentile - - £44.50
90th Percentile - - -
England median hourly rate £34.00 £38.50 £46.18
% change year-on-year -11.69% -16.63% +2.62%

All Cloud Skills
Yorkshire

Azure falls under the Cloud Services category. For comparison with the information above, the following table provides summary statistics for all contract job vacancies requiring cloud computing skills in Yorkshire.

Contract vacancies with a requirement for cloud computing skills 564 522 657
As % of all contract IT jobs advertised in Yorkshire 37.20% 34.94% 31.60%
Number of daily rates quoted 382 362 483
10th Percentile £250 £300 £276
25th Percentile £363 £400 £425
Median daily rate (50th Percentile) £475 £495 £525
Median % change year-on-year -4.04% -5.71% +5.00%
75th Percentile £538 £572 £620
90th Percentile £600 £650 £688
England median daily rate £501 £525 £550
% change year-on-year -4.67% -4.55% -
Number of hourly rates quoted 1 6 4
10th Percentile - £16.88 £18.95
25th Percentile - £20.50 £19.63
Median hourly rate £200.00 £21.50 £21.26
Median % change year-on-year +830.23% +1.15% -3.39%
75th Percentile - £22.00 £28.01
90th Percentile - £25.38 £37.90
England median hourly rate £26.30 £31.00 £33.00
% change year-on-year -15.16% -6.06% +53.49%

Azure
Job Vacancy Trend in Yorkshire

Job postings citing Azure as a proportion of all IT jobs advertised in Yorkshire.

Job vacancy trend for Azure in Yorkshire

Azure
Daily Rate Trend in Yorkshire

Contractor daily rate distribution trend for jobs in Yorkshire citing Azure.

Contractor daily rate distribution trend for jobs in Yorkshire citing Azure

Azure
Daily Rate Histogram in Yorkshire

Daily rate distribution for jobs citing Azure in Yorkshire over the 6 months to 15 September 2025.

Daily rate histogram for Azure in Yorkshire

Azure
Hourly Rate Trend in Yorkshire

Contractor hourly rate distribution trend for jobs in Yorkshire citing Azure.

Contractor hourly rate distribution trend for jobs in Yorkshire citing Azure

Azure
Contract Job Locations in Yorkshire

The table below looks at the demand and provides a guide to the median contractor rates quoted in IT jobs citing Azure within the Yorkshire region over the 6 months to 15 September 2025. The 'Rank Change' column provides an indication of the change in demand within each location based on the same 6 month period last year.

Location Rank Change
on Same Period
Last Year
Matching
Contract
IT Job Ads
Median
Daily Rate
Past 6 Months
Median Daily Rate
% Change
on Same Period
Last Year
Live
Jobs
West Yorkshire -6 99 £500 - 120
South Yorkshire -5 67 £450 -15.89% 47
North Yorkshire -2 9 £275 -45.00% 32
East Yorkshire -6 2 - - 17
Azure
England

Azure
Co-occurring Skills and Capabilities in Yorkshire by Category

The follow tables expand on the table above by listing co-occurrences grouped by category. The same employment type, locality and period is covered with up to 20 co-occurrences shown in each of the following categories:

Application Platforms
1 9 (4.97%) Confluence
2 6 (3.31%) SharePoint
3 4 (2.21%) Apache Airflow
3 4 (2.21%) CMS
4 3 (1.66%) Apache
4 3 (1.66%) Apache Spark
5 2 (1.10%) CICS
5 2 (1.10%) Microsoft Exchange
5 2 (1.10%) Tomcat
5 2 (1.10%) WebSphere
6 1 (0.55%) Umbraco
6 1 (0.55%) WebSphere Application Server
Applications
1 2 (1.10%) Microsoft Excel
1 2 (1.10%) Microsoft Office
2 1 (0.55%) Microsoft PowerPoint
2 1 (0.55%) MS Visio
Business Applications
1 5 (2.76%) Dynamics CRM
2 4 (2.21%) Payment Gateway
3 2 (1.10%) Magento
3 2 (1.10%) SAP S/4HANA
4 1 (0.55%) SAP ERP
4 1 (0.55%) SAP MRS
4 1 (0.55%) SAP PM
4 1 (0.55%) Shopify
Cloud Services
1 89 (49.17%) AWS
2 71 (39.23%) GCP
3 32 (17.68%) Azure DevOps
4 26 (14.36%) Microsoft 365
5 22 (12.15%) Entra ID
6 19 (10.50%) Power Platform
7 16 (8.84%) Azure AKS
7 16 (8.84%) GitHub
8 15 (8.29%) AWS CloudFormation
9 14 (7.73%) Serverless
10 13 (7.18%) SaaS
11 8 (4.42%) Amazon EKS
11 8 (4.42%) Dynamics 365
11 8 (4.42%) Google Kubernetes Engine
11 8 (4.42%) PaaS
12 7 (3.87%) Azure Functions
13 6 (3.31%) Azure Sentinel
13 6 (3.31%) GitHub Actions
14 5 (2.76%) Power Automate
14 5 (2.76%) PowerApps
Communications & Networking
1 20 (11.05%) Firewall
2 9 (4.97%) VPN
3 4 (2.21%) HTTP
3 4 (2.21%) SAN
4 2 (1.10%) HTTPS
4 2 (1.10%) LAN
4 2 (1.10%) NAS
4 2 (1.10%) Network Security
4 2 (1.10%) Reverse Proxy
4 2 (1.10%) TCP/IP
4 2 (1.10%) WAN
4 2 (1.10%) Wi-Fi
5 1 (0.55%) 4G
5 1 (0.55%) Cisco Nexus
5 1 (0.55%) FCoE
5 1 (0.55%) Fibre Channel
5 1 (0.55%) iSCSI
5 1 (0.55%) Multicast
5 1 (0.55%) PSTN
5 1 (0.55%) SSL
Database & Business Intelligence
1 20 (11.05%) PostgreSQL
2 16 (8.84%) NoSQL
2 16 (8.84%) Power BI
3 15 (8.29%) SQL Server
4 11 (6.08%) MongoDB
5 7 (3.87%) Data Warehouse
5 7 (3.87%) Relational Database
6 6 (3.31%) MySQL
7 5 (2.76%) BigQuery
7 5 (2.76%) Tableau
8 4 (2.21%) Azure SQL Database
8 4 (2.21%) Data Lake
8 4 (2.21%) RDBMS
9 3 (1.66%) Amazon Redshift
10 2 (1.10%) Amazon Athena
10 2 (1.10%) Bigtable
10 2 (1.10%) Delta Lake
10 2 (1.10%) Enterprise Data Warehouse
10 2 (1.10%) Power Query
10 2 (1.10%) Spark SQL
Development Applications
1 26 (14.36%) Jenkins
2 23 (12.71%) Git
2 23 (12.71%) JIRA
3 9 (4.97%) SoapUI
4 8 (4.42%) GitLab
4 8 (4.42%) Postman
5 6 (3.31%) Selenium
5 6 (3.31%) SonarQube
6 5 (2.76%) JUnit
6 5 (2.76%) Sonatype Nexus
7 4 (2.21%) Artifactory
7 4 (2.21%) Maven
7 4 (2.21%) Storybook
8 3 (1.66%) git-flow
8 3 (1.66%) TestNG
9 2 (1.10%) CircleCI
9 2 (1.10%) Gradle
9 2 (1.10%) Log4j
9 2 (1.10%) Mockito
9 2 (1.10%) Subversion
General
1 58 (32.04%) Social Skills
2 29 (16.02%) Finance
3 23 (12.71%) Public Sector
4 16 (8.84%) Banking
5 9 (4.97%) Analytical Skills
5 9 (4.97%) Retail
6 7 (3.87%) Documentation Skills
7 5 (2.76%) Legal
8 3 (1.66%) Law
9 2 (1.10%) Police
9 2 (1.10%) Presentation Skills
10 1 (0.55%) Digital Health
10 1 (0.55%) Inclusion and Diversity
10 1 (0.55%) Influencing Skills
10 1 (0.55%) Manufacturing
10 1 (0.55%) Organisational Skills
10 1 (0.55%) Pharmaceutical
10 1 (0.55%) Retail Banking
10 1 (0.55%) Tech for Good
10 1 (0.55%) Telecoms
Job Titles
1 40 (22.10%) Developer
2 28 (15.47%) Analyst
3 24 (13.26%) Architect
4 15 (8.29%) DevOps Engineer
4 15 (8.29%) Senior
5 12 (6.63%) Business Analyst
6 10 (5.52%) Lead
7 9 (4.97%) Azure Engineer
7 9 (4.97%) Infrastructure Engineer
7 9 (4.97%) Test Analyst
8 8 (4.42%) Senior Developer
8 8 (4.42%) Software Engineer
8 8 (4.42%) Solutions Architect
9 7 (3.87%) .NET Software Engineer
9 7 (3.87%) Technical Architect
10 6 (3.31%) Data Engineer
11 5 (2.76%) AWS Engineer
11 5 (2.76%) IT Support
11 5 (2.76%) NetBackup Engineer
11 5 (2.76%) Software Developer
Libraries, Frameworks & Software Standards
1 24 (13.26%) .NET
2 22 (12.15%) RESTful
3 16 (8.84%) Node.js
4 11 (6.08%) Kafka
5 10 (5.52%) JSON
5 10 (5.52%) React
6 9 (4.97%) SAML
7 8 (4.42%) CSS
7 8 (4.42%) HTML
7 8 (4.42%) Next.js
7 8 (4.42%) OAuth
7 8 (4.42%) OpenID
8 7 (3.87%) Django
8 7 (3.87%) Regular Expression
8 7 (3.87%) REST
9 6 (3.31%) CSS3
9 6 (3.31%) HTML5
9 6 (3.31%) OpenCV
9 6 (3.31%) Spring
9 6 (3.31%) TensorFlow
Miscellaneous
1 20 (11.05%) Cloud Native
2 15 (8.29%) Onboarding
3 13 (7.18%) Product Ownership
4 7 (3.87%) NHS
5 5 (2.76%) Data Centre
6 4 (2.21%) Legacy Systems
6 4 (2.21%) Security Posture
7 3 (1.66%) CCTV
7 3 (1.66%) Data Protection Act
7 3 (1.66%) Data Structures
7 3 (1.66%) Hybrid Cloud
7 3 (1.66%) Operational Technology
8 2 (1.10%) Algorithms
8 2 (1.10%) Clustering
8 2 (1.10%) Cyber Defence
8 2 (1.10%) Mainframe
8 2 (1.10%) Mobile App
8 2 (1.10%) Public Cloud
8 2 (1.10%) Replication
9 1 (0.55%) Greenfield Project
Operating Systems
1 15 (8.29%) Windows
2 14 (7.73%) Linux
3 6 (3.31%) Unix
4 3 (1.66%) Windows 10
5 2 (1.10%) Android
5 2 (1.10%) Apple iOS
5 2 (1.10%) Solaris
5 2 (1.10%) Windows Server
5 2 (1.10%) zOS
6 1 (0.55%) Mac OS X
6 1 (0.55%) MVS
6 1 (0.55%) VMS
Processes & Methodologies
1 71 (39.23%) DevOps
2 59 (32.60%) CI/CD
3 48 (26.52%) Agile
4 31 (17.13%) Infrastructure as Code
5 25 (13.81%) Stakeholder Management
6 24 (13.26%) Problem-Solving
7 23 (12.71%) Cybersecurity
7 23 (12.71%) Microservices
8 21 (11.60%) Containerisation
9 19 (10.50%) Scrum
10 17 (9.39%) Clean Code
11 16 (8.84%) Business Intelligence
11 16 (8.84%) Mentoring
11 16 (8.84%) RBAC
11 16 (8.84%) Translating Business Requirements
12 15 (8.29%) Cloud Security
12 15 (8.29%) Code Quality
12 15 (8.29%) DevSecOps
13 14 (7.73%) Machine Learning
13 14 (7.73%) Test Automation
Programming Languages
1 48 (26.52%) Python
2 41 (22.65%) SQL
3 23 (12.71%) Java
4 17 (9.39%) C#
5 15 (8.29%) PowerShell
6 14 (7.73%) JavaScript
7 12 (6.63%) Bash
8 7 (3.87%) Bicep
8 7 (3.87%) TypeScript
9 3 (1.66%) Data Analysis Expressions
9 3 (1.66%) PHP
9 3 (1.66%) Search Processing Language
10 2 (1.10%) ANSI SQL
10 2 (1.10%) Scala
10 2 (1.10%) Shell Script
11 1 (0.55%) Go
11 1 (0.55%) Groovy
11 1 (0.55%) R
11 1 (0.55%) Rust
11 1 (0.55%) VB
Qualifications
1 17 (9.39%) Security Cleared
2 11 (6.08%) SC Cleared
3 10 (5.52%) ISTQB
4 9 (4.97%) Azure Certification
5 8 (4.42%) CISM
5 8 (4.42%) CISSP
6 5 (2.76%) Degree
7 4 (2.21%) AWS Certification
7 4 (2.21%) Microsoft Certification
8 3 (1.66%) BPSS Clearance
9 2 (1.10%) CEH
9 2 (1.10%) CISMP
9 2 (1.10%) GIAC
9 2 (1.10%) GSEC
9 2 (1.10%) GWAPT
10 1 (0.55%) AWS Certified Solutions Architect
10 1 (0.55%) BC Cleared
10 1 (0.55%) DBS Check
10 1 (0.55%) OCP
10 1 (0.55%) Oracle Certification
Quality Assurance & Compliance
1 12 (6.63%) GDPR
2 10 (5.52%) QA
3 8 (4.42%) ISO/IEC 27001
4 7 (3.87%) NIST
4 7 (3.87%) PCI DSS
5 6 (3.31%) Data Quality
6 3 (1.66%) HIPAA
6 3 (1.66%) NCSC
6 3 (1.66%) SOC 2
7 2 (1.10%) Accessibility
7 2 (1.10%) COBIT
8 1 (0.55%) HL7
8 1 (0.55%) Sarbanes-Oxley
System Software
1 27 (14.92%) Docker
2 21 (11.60%) Active Directory
3 7 (3.87%) Virtual Machines
3 7 (3.87%) VMware Infrastructure
4 4 (2.21%) Hyper-V
5 2 (1.10%) KVM
6 1 (0.55%) Apache ZooKeeper
6 1 (0.55%) BitLocker
6 1 (0.55%) NFS
6 1 (0.55%) Snort
6 1 (0.55%) SRDF
6 1 (0.55%) Veritas Cluster Server
6 1 (0.55%) Virtual Desktop
6 1 (0.55%) VMware ESXi
6 1 (0.55%) Xen
Systems Management
1 50 (27.62%) Terraform
2 37 (20.44%) Kubernetes
3 16 (8.84%) Ansible
4 9 (4.97%) Single Sign-On
5 8 (4.42%) Microsoft Intune
6 5 (2.76%) NetBackup
6 5 (2.76%) Oracle RMAN
7 4 (2.21%) Prometheus
8 3 (1.66%) Grafana
9 2 (1.10%) Control-M
9 2 (1.10%) Puppet
9 2 (1.10%) SCCM
10 1 (0.55%) Progress Chef
10 1 (0.55%) SCOM
10 1 (0.55%) vCenter Server
Vendors
1 64 (35.36%) Microsoft
2 27 (14.92%) Google
3 13 (7.18%) CyberArk
3 13 (7.18%) Databricks
4 11 (6.08%) Oracle
5 10 (5.52%) F5
6 8 (4.42%) Alibaba
6 8 (4.42%) BeyondTrust
6 8 (4.42%) Cisco
6 8 (4.42%) Salesforce
6 8 (4.42%) Thycotic
7 7 (3.87%) SAP
7 7 (3.87%) VMware
8 5 (2.76%) Veritas
9 4 (2.21%) HP
9 4 (2.21%) Splunk
10 3 (1.66%) Citrix
10 3 (1.66%) Dell
10 3 (1.66%) Dynatrace
10 3 (1.66%) Imperva