Full Stack Development Jobs in Cambridge

Full-Stack Development
Cambridgeshire > Cambridge

The following table provides summary statistics for permanent job vacancies advertised in Cambridge with a requirement for Full Stack Development skills. Included is a benchmarking guide to the salaries offered in vacancies that have cited Full Stack Development over the 6 months to 20 May 2024 with a comparison to the same period in the previous 2 years.

6 months to
20 May 2024
Same period 2023 Same period 2022
Rank 44 68 62
Rank change year-on-year +24 -6 +4
Permanent jobs citing Full Stack Development 39 20 73
As % of all permanent jobs advertised in Cambridge 3.88% 2.16% 4.28%
As % of the Processes & Methodologies category 4.70% 2.25% 4.43%
Number of salaries quoted 38 17 17
10th Percentile £52,500 £32,500 -
25th Percentile £61,250 £42,500 £50,000
Median annual salary (50th Percentile) £68,500 £55,000 £57,500
Median % change year-on-year +24.55% -4.35% -
75th Percentile £80,000 £68,750 £76,000
90th Percentile £93,750 £92,750 £88,750
Cambridgeshire median annual salary £65,000 £55,000 £56,250
% change year-on-year +18.18% -2.22% +12.50%

All Process and Methodology Skills
Cambridge

Full Stack Development is in the Processes and Methodologies category. The following table is for comparison with the above and provides summary statistics for all permanent job vacancies advertised in Cambridge with a requirement for process or methodology skills.

Permanent vacancies with a requirement for process or methodology skills 829 888 1,647
As % of all permanent jobs advertised in Cambridge 82.41% 95.79% 96.49%
Number of salaries quoted 631 375 551
10th Percentile £32,500 £31,200 £32,500
25th Percentile £42,500 £40,375 £42,500
Median annual salary (50th Percentile) £60,000 £57,500 £55,000
Median % change year-on-year +4.35% +4.55% -
75th Percentile £75,000 £75,000 £71,875
90th Percentile £87,500 £91,500 £85,000
Cambridgeshire median annual salary £55,000 £54,000 £51,750
% change year-on-year +1.85% +4.35% -1.43%

Full Stack Development
Job Vacancy Trend in Cambridge

Job postings citing Full Stack Development as a proportion of all IT jobs advertised in Cambridge.
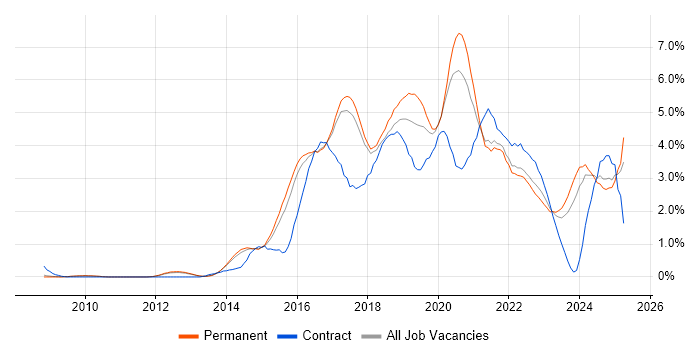
Job vacancy trend for Full Stack Development in Cambridge

Full Stack Development
Salary Trend in Cambridge

3-month moving average salary quoted in jobs citing Full Stack Development in Cambridge.

Salary trend for Full Stack Development in Cambridge

Full Stack Development
Salary Histogram in Cambridge

Salary distribution for jobs citing Full Stack Development in Cambridge over the 6 months to 20 May 2024.

Salary histogram for Full Stack Development in Cambridge

Full Stack Development
Co-occurring Skills and Capabilities in Cambridge by Category

The follow tables expand on the table above by listing co-occurrences grouped by category. The same employment type, locality and period is covered with up to 20 co-occurrences shown in each of the following categories:

Cloud Services
1 23 (58.97%) AWS
2 9 (23.08%) Azure
3 3 (7.69%) AWS Lambda
3 3 (7.69%) Serverless
4 2 (5.13%) Amazon EC2
4 2 (5.13%) Amazon S3
4 2 (5.13%) SaaS
Communications & Networking
1 1 (2.56%) Cisco IOS
1 1 (2.56%) Internet
1 1 (2.56%) NAS
1 1 (2.56%) SAN
Database & Business Intelligence
1 8 (20.51%) SQL Server
2 6 (15.38%) Elasticsearch
2 6 (15.38%) MongoDB
3 2 (5.13%) Relational Database
Development Applications
1 8 (20.51%) TeamCity
General
1 11 (28.21%) Tech for Good
2 10 (25.64%) Finance
3 4 (10.26%) Law
3 4 (10.26%) Military
3 4 (10.26%) Social Skills
4 1 (2.56%) Games
4 1 (2.56%) Organisational Skills
4 1 (2.56%) Publishing
4 1 (2.56%) Retail
Job Titles
1 19 (48.72%) Developer
2 11 (28.21%) Senior
3 10 (25.64%) Software Engineer
4 9 (23.08%) Full Stack Developer
5 7 (17.95%) .NET Developer
5 7 (17.95%) Full Stack Engineer
6 4 (10.26%) Senior Full Stack Engineer
6 4 (10.26%) Senior Software Engineer
7 3 (7.69%) Lead
7 3 (7.69%) Software Developer
8 2 (5.13%) Front-End Engineer (Client-Side Engineer)
8 2 (5.13%) Full Stack Web Developer
8 2 (5.13%) Scientific Software Developer
8 2 (5.13%) Senior Developer
8 2 (5.13%) Senior Software Developer
8 2 (5.13%) Web Developer
9 1 (2.56%) .NET Software Engineer
9 1 (2.56%) AWS Engineer
9 1 (2.56%) Infrastructure Engineer
9 1 (2.56%) Senior Infrastructure Engineer
Libraries, Frameworks & Software Standards
1 30 (76.92%) React
2 19 (48.72%) .NET
3 12 (30.77%) Node.js
4 10 (25.64%) AngularJS
5 7 (17.95%) .NET Core
5 7 (17.95%) ASP.NET
5 7 (17.95%) ASP.NET Web API
5 7 (17.95%) Vue
6 6 (15.38%) .NET Framework
6 6 (15.38%) ASP.NET MVC
6 6 (15.38%) CSS
6 6 (15.38%) Django
6 6 (15.38%) Entity Framework
6 6 (15.38%) HTML
7 3 (7.69%) CSS3
7 3 (7.69%) HTML5
7 3 (7.69%) OpenID
7 3 (7.69%) SAML
8 2 (5.13%) Kafka
8 2 (5.13%) Spring
Miscellaneous
1 2 (5.13%) Algorithms
1 2 (5.13%) Client/Server
1 2 (5.13%) Cloud Native
1 2 (5.13%) Cyber Threat
1 2 (5.13%) Data Structures
1 2 (5.13%) Renewable Energy
1 2 (5.13%) Security Posture
2 1 (2.56%) Virtual Team
Operating Systems
1 1 (2.56%) Linux
1 1 (2.56%) Windows
1 1 (2.56%) Windows Server
Processes & Methodologies
1 24 (61.54%) Agile
2 23 (58.97%) Software Engineering
3 9 (23.08%) Kanban
3 9 (23.08%) Scrum
4 8 (20.51%) Front End Development
4 8 (20.51%) Release Management
4 8 (20.51%) TDD
5 7 (17.95%) Fintech
5 7 (17.95%) Microservices
6 6 (15.38%) Asset Management
6 6 (15.38%) BDD
6 6 (15.38%) MVC
6 6 (15.38%) Wealth Management
7 5 (12.82%) Chemistry
7 5 (12.82%) Continuous Delivery
7 5 (12.82%) Line Management
7 5 (12.82%) Problem-Solving
7 5 (12.82%) Test Automation
8 4 (10.26%) Containerisation
8 4 (10.26%) Fraud Detection
Programming Languages
1 24 (61.54%) TypeScript
2 20 (51.28%) C#
3 18 (46.15%) JavaScript
4 16 (41.03%) Python
5 6 (15.38%) Java
6 1 (2.56%) C++
6 1 (2.56%) Go
6 1 (2.56%) Kotlin
6 1 (2.56%) PowerShell
6 1 (2.56%) SQL
Qualifications
1 6 (15.38%) Degree
2 2 (5.13%) Computer Science Degree
2 2 (5.13%) PhD
System Software
1 4 (10.26%) Docker
2 1 (2.56%) Active Directory
2 1 (2.56%) VMware ESXi
2 1 (2.56%) VMware Infrastructure
Systems Management
1 8 (20.51%) Kubernetes
1 8 (20.51%) Terraform
2 1 (2.56%) vCenter Server
Vendors
1 8 (20.51%) Microsoft
2 1 (2.56%) Cisco
2 1 (2.56%) Dell
2 1 (2.56%) Veeam
2 1 (2.56%) VMware