C++
Cambridgeshire > Cambridge
The table below provides summary statistics and salary benchmarking for jobs advertised in Cambridge requiring C++ skills. It covers permanent job vacancies from the 6 months leading up to 23 February 2026, with comparisons to the same periods in the previous two years.
| 6 months to 23 Feb 2026 |
Same period 2025 | Same period 2024 | |
|---|---|---|---|
| Rank | 14 | 22 | 21 |
| Rank change year-on-year | +8 | -1 | +8 |
| Permanent jobs citing C++ | 52 | 36 | 74 |
| As % of all permanent jobs in Cambridge | 9.04% | 8.53% | 8.63% |
| As % of the Programming Languages category | 33.33% | 17.14% | 16.78% |
| Number of salaries quoted | 46 | 17 | 29 |
| 10th Percentile | £47,500 | £34,500 | £37,500 |
| 25th Percentile | £55,000 | £47,500 | £52,500 |
| Median annual salary (50th Percentile) | £67,500 | £55,000 | £60,000 |
| Median % change year-on-year | +22.73% | -8.33% | +4.35% |
| 75th Percentile | £74,375 | £78,750 | £82,500 |
| 90th Percentile | £90,000 | - | £92,500 |
| Cambridgeshire median annual salary | £67,500 | £55,000 | £60,000 |
| % change year-on-year | +22.73% | -8.33% | - |
All Programming Languages
Cambridge
C++ falls under the Programming Languages category. For comparison with the information above, the following table provides summary statistics for all permanent job vacancies requiring coding skills in Cambridge.
| Permanent vacancies with a requirement for coding skills | 156 | 210 | 441 |
| As % of all permanent jobs advertised in Cambridge | 27.13% | 49.76% | 51.46% |
| Number of salaries quoted | 111 | 106 | 307 |
| 10th Percentile | £41,250 | £42,500 | £42,000 |
| 25th Percentile | £48,750 | £47,500 | £51,875 |
| Median annual salary (50th Percentile) | £60,000 | £67,500 | £62,500 |
| Median % change year-on-year | -11.11% | +8.00% | +4.17% |
| 75th Percentile | £75,000 | £74,688 | £83,750 |
| 90th Percentile | £83,750 | £83,375 | £92,500 |
| Cambridgeshire median annual salary | £60,000 | £58,850 | £60,000 |
| % change year-on-year | +1.95% | -1.92% | - |
C++
Job Vacancy Trend in Cambridge
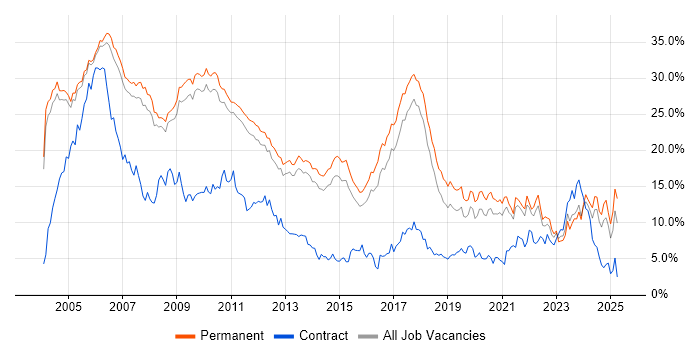
Historical trend showing the proportion of permanent IT job postings citing C++ relative to all permanent IT jobs advertised in Cambridge.

C++
Salary Trend in Cambridge
Salary distribution trend for jobs in Cambridge citing C++.

C++
Salary Histogram in Cambridge
Salary distribution for jobs citing C++ in Cambridge over the 6 months to 23 February 2026.
C++
Co-Occurring Skills & Capabilities in Cambridge by Category
The following tables expand on the one above by listing co-occurrences grouped by category. They cover the same employment type, locality and period, with up to 20 co-occurrences shown in each category:
|
|
||||||||||||||||||||||||||||||||||||||||||||||||||||||||||||||||||||||||||||||||||||||||||
|
|
||||||||||||||||||||||||||||||||||||||||||||||||||||||||||||||||||||||||||||||||||||||||||
|
|
||||||||||||||||||||||||||||||||||||||||||||||||||||||||||||||||||||||||||||||||||||||||||
|
|
||||||||||||||||||||||||||||||||||||||||||||||||||||||||||||||||||||||||||||||||||||||||||
|
|
||||||||||||||||||||||||||||||||||||||||||||||||||||||||||||||||||||||||||||||||||||||||||
|
|
||||||||||||||||||||||||||||||||||||||||||||||||||||||||||||||||||||||||||||||||||||||||||
|
|
||||||||||||||||||||||||||||||||||||||||||||||||||||||||||||||||||||||||||||||||||||||||||
|
|
||||||||||||||||||||||||||||||||||||||||||||||||||||||||||||||||||||||||||||||||||||||||||
