Onboarding Jobs in Cambridge

Onboarding
Cambridgeshire > Cambridge

The table below looks at the prevalence of the term Onboarding in permanent job vacancies advertised in Cambridge. Included is a benchmarking guide to the salaries offered in vacancies that have cited Onboarding over the 6 months to 3 May 2024 with a comparison to the same period over the previous 2 years.

6 months to
3 May 2024
Same period 2023 Same period 2022
Rank 72 63 111
Rank change year-on-year -9 +48 -31
Permanent jobs citing Onboarding 11 37 24
As % of all permanent jobs advertised in Cambridge 1.11% 3.70% 1.46%
As % of the Miscellaneous category 2.26% 6.98% 2.31%
Number of salaries quoted 5 14 12
10th Percentile - £45,625 -
25th Percentile £29,000 £67,500 £43,750
Median annual salary (50th Percentile) £44,750 £75,000 £47,500
Median % change year-on-year -40.33% +57.89% -32.14%
75th Percentile £46,125 - £52,188
90th Percentile - £76,750 £57,250
Cambridgeshire median annual salary £28,500 £70,000 £47,500
% change year-on-year -59.29% +47.37% -32.14%

All Generic Skills
Cambridge

Onboarding is in the General and Transferable Skills category. The following table is for comparison with the above and provides summary statistics for all permanent job vacancies advertised in Cambridge with a requirement for generic IT skills.

Permanent vacancies with a requirement for generic IT skills 487 530 1,038
As % of all permanent jobs advertised in Cambridge 48.99% 53.00% 63.18%
Number of salaries quoted 356 177 219
10th Percentile £32,500 £32,500 £32,151
25th Percentile £42,500 £43,750 £40,625
Median annual salary (50th Percentile) £55,000 £60,000 £52,500
Median % change year-on-year -8.33% +14.29% -12.50%
75th Percentile £74,813 £75,000 £70,000
90th Percentile £83,750 £87,500 £83,250
Cambridgeshire median annual salary £55,000 £60,000 £52,500
% change year-on-year -8.33% +14.29% -12.50%

Onboarding
Job Vacancy Trend in Cambridge

Job postings citing Onboarding as a proportion of all IT jobs advertised in Cambridge.
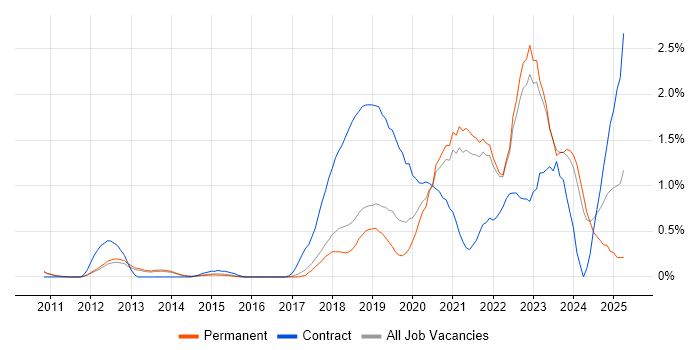
Job vacancy trend for Onboarding in Cambridge

Onboarding
Salary Trend in Cambridge

3-month moving average salary quoted in jobs citing Onboarding in Cambridge.

Salary trend for Onboarding in Cambridge

Onboarding
Co-occurring Skills and Capabilities in Cambridge by Category

The follow tables expand on the table above by listing co-occurrences grouped by category. The same employment type, locality and period is covered with up to 20 co-occurrences shown in each of the following categories:

Application Platforms
1 2 (18.18%) Apache
1 2 (18.18%) Apache Spark
Applications
1 4 (36.36%) Microsoft Excel
Business Applications
1 3 (27.27%) Salesforce CRM
Cloud Services
1 8 (72.73%) AWS
2 6 (54.55%) Amazon EMR
3 2 (18.18%) Amazon Kinesis
3 2 (18.18%) Amazon S3
3 2 (18.18%) AWS Lambda
3 2 (18.18%) Google Workspace
3 2 (18.18%) Serverless
Database & Business Intelligence
1 6 (54.55%) Amazon Redshift
2 4 (36.36%) Big Data
2 4 (36.36%) PowerPivot
2 4 (36.36%) QlikView
2 4 (36.36%) Tableau
3 2 (18.18%) Apache Hive
3 2 (18.18%) Data Warehouse
3 2 (18.18%) Delta Lake
3 2 (18.18%) Hadoop
3 2 (18.18%) Metadata
3 2 (18.18%) Relational Database
Development Applications
1 2 (18.18%) Git
General
1 7 (63.64%) Analytical Skills
1 7 (63.64%) Social Skills
2 4 (36.36%) Finance
3 3 (27.27%) Presentation Skills
4 2 (18.18%) Pharmaceutical
Job Titles
1 4 (36.36%) Analyst
1 4 (36.36%) Business Analyst
1 4 (36.36%) Data Engineer
2 3 (27.27%) Lead
3 2 (18.18%) Junior
3 2 (18.18%) Junior Data Engineer
Libraries, Frameworks & Software Standards
1 4 (36.36%) Django
2 2 (18.18%) Node.js
Miscellaneous
1 3 (27.27%) Management Information System
2 2 (18.18%) Algorithms
2 2 (18.18%) Distributed Systems
2 2 (18.18%) Life Science
2 2 (18.18%) Self-Motivation
Processes & Methodologies
1 8 (72.73%) Computer Science
1 8 (72.73%) ETL
2 6 (54.55%) Analytics
2 6 (54.55%) Customer-Centricity
2 6 (54.55%) Mathematics
2 6 (54.55%) Process Improvement
2 6 (54.55%) Visualisation
3 4 (36.36%) Business Analysis
3 4 (36.36%) Business Analytics
3 4 (36.36%) Cost Reduction
3 4 (36.36%) Data Analysis
3 4 (36.36%) Data Modelling
3 4 (36.36%) Data Visualisation
3 4 (36.36%) Economics
3 4 (36.36%) Logistics
3 4 (36.36%) Network Planning
3 4 (36.36%) Operations Research
3 4 (36.36%) Performance Metrics
3 4 (36.36%) Root Cause Analysis
3 4 (36.36%) Statistics
Programming Languages
1 8 (72.73%) Python
2 6 (54.55%) R
2 6 (54.55%) SQL
3 4 (36.36%) VBA
4 2 (18.18%) Java
4 2 (18.18%) Scala
Qualifications
1 8 (72.73%) Degree
2 4 (36.36%) Computer Science Degree
3 3 (27.27%) DBS Check
4 2 (18.18%) Master's Degree
Quality Assurance & Compliance
1 2 (18.18%) Accessibility
1 2 (18.18%) GDPR
Vendors
1 4 (36.36%) Microsoft
1 4 (36.36%) MicroStrategy
1 4 (36.36%) Oracle
2 3 (27.27%) Salesforce