Oracle Jobs in Southampton

Oracle
Hampshire > Southampton

The table below provides summary statistics for permanent job vacancies advertised in Southampton with a requirement for knowledge and experience of Oracle products and/or services. Included is a benchmarking guide to the salaries offered in vacancies that have cited Oracle over the 6 months to 7 May 2024 with a comparison to the same period in the previous 2 years.

The figures below represent the IT labour market in general and are not representative of salaries within the Oracle Corporation.

6 months to
7 May 2024
Same period 2023 Same period 2022
Rank 37 62 79
Rank change year-on-year +25 +17 -42
Permanent jobs citing Oracle 42 14 35
As % of all permanent jobs advertised in Southampton 4.88% 1.82% 2.86%
As % of the Vendors category 11.23% 4.83% 8.12%
Number of salaries quoted 24 13 29
10th Percentile £32,375 £44,000 £26,250
25th Percentile £36,500 £61,250 £35,000
Median annual salary (50th Percentile) £45,000 £72,500 £55,000
Median % change year-on-year -37.93% +31.82% +37.50%
75th Percentile £53,125 £73,750 £62,500
90th Percentile £61,750 - £63,750
Hampshire median annual salary £50,000 £66,250 £50,000
% change year-on-year -24.53% +32.50% +11.11%

All Vendors
Southampton

Oracle is in the Vendor Products and Services category. The following table is for comparison with the above and provides summary statistics for all permanent job vacancies with a requirement for knowledge or experience of vendor products and services advertised in Southampton.

Permanent vacancies with a requirement for knowledge or experience of vendor products and services 374 290 431
As % of all permanent jobs advertised in Southampton 43.49% 37.61% 35.27%
Number of salaries quoted 304 251 304
10th Percentile £27,325 £27,500 £27,325
25th Percentile £31,250 £33,750 £36,250
Median annual salary (50th Percentile) £45,000 £46,000 £50,000
Median % change year-on-year -2.17% -8.00% +15.89%
75th Percentile £60,000 £67,500 £62,500
90th Percentile £72,125 £77,500 £77,500
Hampshire median annual salary £47,500 £45,500 £48,500
% change year-on-year +4.40% -6.19% +2.11%

Oracle
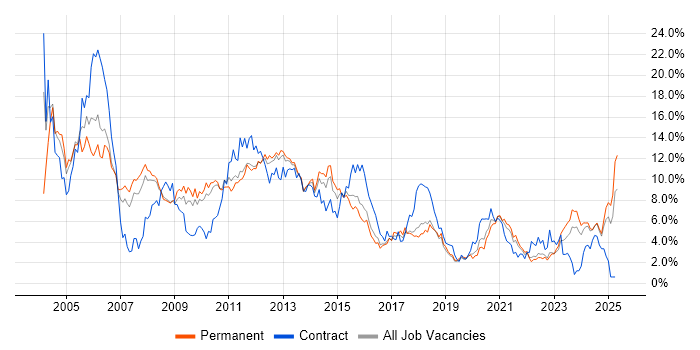
Job Vacancy Trend in Southampton

Job postings citing Oracle as a proportion of all IT jobs advertised in Southampton.

Job vacancy trend for Oracle in Southampton

Oracle
Salary Trend in Southampton

3-month moving average salary quoted in jobs citing Oracle in Southampton.

Salary trend for Oracle in Southampton

Oracle
Salary Histogram in Southampton

Salary distribution for jobs citing Oracle in Southampton over the 6 months to 7 May 2024.

Salary histogram for Oracle in Southampton

Oracle
Co-occurring Skills and Capabilities in Southampton by Category

The follow tables expand on the table above by listing co-occurrences grouped by category. The same employment type, locality and period is covered with up to 20 co-occurrences shown in each of the following categories:

Application Platforms
1 5 (11.90%) Camunda
1 5 (11.90%) nginx
2 4 (9.52%) Confluence
3 3 (7.14%) IIS
4 1 (2.38%) WebLogic
Applications
1 3 (7.14%) Microsoft Office
Business Applications
1 11 (26.19%) NetSuite
Cloud Services
1 5 (11.90%) Azure
1 5 (11.90%) IBM Cloud
1 5 (11.90%) OCI
1 5 (11.90%) OpenShift
2 4 (9.52%) AWS
Communications & Networking
1 3 (7.14%) Internet
1 3 (7.14%) VPN
2 1 (2.38%) Firewall
Database & Business Intelligence
1 9 (21.43%) Oracle Database
2 8 (19.05%) SQL Server
3 5 (11.90%) MongoDB
4 4 (9.52%) NoSQL
4 4 (9.52%) Relational Database
4 4 (9.52%) SQL Server Integration Services
5 1 (2.38%) Oracle Reports
5 1 (2.38%) PostgreSQL
5 1 (2.38%) SQL Server Reporting Services
Development Applications
1 4 (9.52%) Git
1 4 (9.52%) JIRA
1 4 (9.52%) Selenium
General
1 12 (28.57%) Manufacturing
2 10 (23.81%) Finance
3 8 (19.05%) Public Sector
4 6 (14.29%) Analytical Skills
5 5 (11.90%) Inclusion and Diversity
6 4 (9.52%) Retail
6 4 (9.52%) Social Skills
7 3 (7.14%) Aerospace
Job Titles
1 17 (40.48%) Consultant
2 15 (35.71%) Implementation Consultant
3 11 (26.19%) ERP Consultant
3 11 (26.19%) ERP Implementation Consultant
4 6 (14.29%) Developer
5 5 (11.90%) Cloud Engineer
5 5 (11.90%) Full Stack Engineer
6 4 (9.52%) Analyst
6 4 (9.52%) Cloud Developer
6 4 (9.52%) Java Developer
6 4 (9.52%) Senior
6 4 (9.52%) Senior Developer
6 4 (9.52%) Senior Java Developer
7 3 (7.14%) Database Engineer
7 3 (7.14%) IT Analyst
7 3 (7.14%) IT Support
7 3 (7.14%) IT Support Analyst
7 3 (7.14%) Software Analyst
7 3 (7.14%) Software Support Analyst
7 3 (7.14%) Support Analyst
Libraries, Frameworks & Software Standards
1 9 (21.43%) React
2 5 (11.90%) KeystoneJS
2 5 (11.90%) Node.js
2 5 (11.90%) Swagger
3 4 (9.52%) AngularJS
3 4 (9.52%) CSS
3 4 (9.52%) Spring
4 1 (2.38%) PostGIS
Miscellaneous
1 9 (21.43%) Data Structures
2 8 (19.05%) Management Information System
2 8 (19.05%) Self-Motivation
3 5 (11.90%) Blockchain
3 5 (11.90%) e-Learning
3 5 (11.90%) Hybrid Cloud
Operating Systems
1 3 (7.14%) Linux
1 3 (7.14%) Windows
2 2 (4.76%) Oracle Linux
Processes & Methodologies
1 15 (35.71%) ERP
2 13 (30.95%) Business Process Analysis
3 11 (26.19%) Budget Management
4 10 (23.81%) Problem-Solving
5 9 (21.43%) Mentoring
6 8 (19.05%) Customer Service
6 8 (19.05%) Project Management
6 8 (19.05%) Software Testing
7 7 (16.67%) Continuous Improvement
8 6 (14.29%) Human Resource Management
8 6 (14.29%) Project Planning
9 5 (11.90%) Artificial Intelligence
9 5 (11.90%) Coaching
9 5 (11.90%) Full Stack Development
9 5 (11.90%) SDLC
9 5 (11.90%) Technology Transformation
10 4 (9.52%) Data-Driven Decision Making
10 4 (9.52%) Disruptive Innovation
10 4 (9.52%) Microservices
10 4 (9.52%) Requirements Gathering
Programming Languages
1 19 (45.24%) SQL
2 9 (21.43%) Java
2 9 (21.43%) JavaScript
3 5 (11.90%) Lua
4 1 (2.38%) T-SQL
Qualifications
1 8 (19.05%) Degree
2 2 (4.76%) Computer Science Degree
Quality Assurance & Compliance
1 4 (9.52%) QA
2 3 (7.14%) SLA
System Software
1 9 (21.43%) Docker
2 3 (7.14%) Active Directory
3 1 (2.38%) Oracle RAC
Systems Management
1 4 (9.52%) Kubernetes
2 1 (2.38%) Data Guard
2 1 (2.38%) Oracle Enterprise Manager
2 1 (2.38%) Oracle RMAN
Vendors
1 15 (35.71%) Sage
1 15 (35.71%) SAP
2 10 (23.81%) Epicor
3 5 (11.90%) IBM
3 5 (11.90%) Red Hat
4 4 (9.52%) Google
4 4 (9.52%) Infor
4 4 (9.52%) Microsoft