Retailing
Durham > Stockton-on-Tees
The table below looks at the prevalence of the term Retail in permanent job vacancies in Stockton-on-Tees. Included is a benchmarking guide to the salaries offered in vacancies that cited Retail over the 6 months leading up to 23 May 2025, comparing them to the same period in the previous two years.
| 6 months to 23 May 2025 |
Same period 2024 | Same period 2023 | |
|---|---|---|---|
| Rank | 8 | - | - |
| Rank change year-on-year | - | - | - |
| Permanent jobs citing Retail | 1 | 0 | 0 |
| As % of all permanent jobs advertised in Stockton-on-Tees | 4.55% | - | - |
| As % of the General category | 10.00% | - | - |
| Number of salaries quoted | 0 | 0 | 0 |
| Median annual salary (50th Percentile) | - | - | - |
| Durham median annual salary | £28,188 | £40,001 | £37,032 |
| % change year-on-year | -29.53% | +8.02% | +22.22% |
All General Skills
Stockton-on-Tees
Retail falls under the General Skills category. For comparison with the information above, the following table provides summary statistics for all permanent job vacancies requiring common skills in Stockton-on-Tees.
| Permanent vacancies with a requirement for common skills | 10 | 17 | 6 |
| As % of all permanent jobs advertised in Stockton-on-Tees | 45.45% | 17.17% | 12.24% |
| Number of salaries quoted | 2 | 14 | 6 |
| 10th Percentile | - | - | £33,000 |
| 25th Percentile | - | £26,250 | £33,016 |
| Median annual salary (50th Percentile) | £23,504 | £40,000 | £36,000 |
| Median % change year-on-year | -41.24% | +11.11% | +3.60% |
| 75th Percentile | - | £49,676 | £39,707 |
| 90th Percentile | - | £54,120 | £41,846 |
| Durham median annual salary | £25,087 | £42,500 | £37,032 |
| % change year-on-year | -40.97% | +14.77% | -1.70% |
Retail
Job Vacancy Trend in Stockton-on-Tees
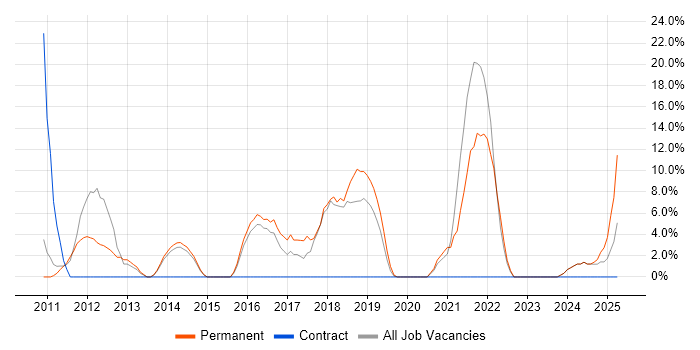
Job postings citing Retail as a proportion of all IT jobs advertised in Stockton-on-Tees.

Retail
Salary Trend in Stockton-on-Tees
3-month moving average salary quoted in jobs citing Retail in Stockton-on-Tees.
Retail
Co-occurring Skills and Capabilities in Stockton-on-Tees by Category
The follow tables expand on the table above by listing co-occurrences grouped by category. The same employment type, locality and period is covered with up to 20 co-occurrences shown in each of the following categories:
|
|
||||||||||||
|
|||||||||||||
