Retailing
Durham > Stockton-on-Tees
The table below looks at the prevalence of the term Retail in permanent job vacancies in Stockton-on-Tees. Included is a benchmarking guide to the salaries offered in vacancies that cited Retail over the 6 months leading up to 30 July 2025, comparing them to the same period in the previous two years.
| 6 months to 30 Jul 2025 |
Same period 2024 | Same period 2023 | |
|---|---|---|---|
| Rank | 9 | 24 | - |
| Rank change year-on-year | +15 | - | - |
| Permanent jobs citing Retail | 4 | 1 | 0 |
| As % of all permanent jobs advertised in Stockton-on-Tees | 6.45% | 1.03% | - |
| As % of the General category | 16.67% | 5.26% | - |
| Number of salaries quoted | 3 | 0 | 0 |
| Median annual salary (50th Percentile) | £50,000 | - | - |
| Durham median annual salary | £28,188 | £58,800 | £55,000 |
| % change year-on-year | -52.06% | +6.91% | +81.52% |
All General Skills
Stockton-on-Tees
Retail falls under the General Skills category. For comparison with the information above, the following table provides summary statistics for all permanent job vacancies requiring common skills in Stockton-on-Tees.
| Permanent vacancies with a requirement for common skills | 24 | 19 | 9 |
| As % of all permanent jobs advertised in Stockton-on-Tees | 38.71% | 19.59% | 25.71% |
| Number of salaries quoted | 13 | 15 | 8 |
| 10th Percentile | £23,820 | £12,000 | £29,475 |
| 25th Percentile | - | £28,750 | £33,000 |
| Median annual salary (50th Percentile) | £25,084 | £40,000 | £37,971 |
| Median % change year-on-year | -37.29% | +5.34% | -5.07% |
| 75th Percentile | £35,000 | £52,284 | £43,938 |
| 90th Percentile | £50,000 | £54,000 | £47,275 |
| Durham median annual salary | £25,087 | £45,000 | £44,000 |
| % change year-on-year | -44.25% | +2.27% | +12.24% |
Retail
Job Vacancy Trend in Stockton-on-Tees
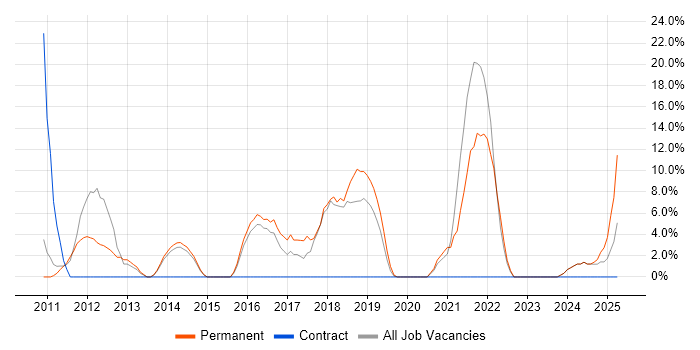
Job postings citing Retail as a proportion of all IT jobs advertised in Stockton-on-Tees.

Retail
Salary Trend in Stockton-on-Tees
3-month moving average salary quoted in jobs citing Retail in Stockton-on-Tees.
Retail
Co-occurring Skills and Capabilities in Stockton-on-Tees by Category
The follow tables expand on the table above by listing co-occurrences grouped by category. The same employment type, locality and period is covered with up to 20 co-occurrences shown in each of the following categories:
|
|
||||||||||||||||||
|
|||||||||||||||||||
