Culture of Ownership (Ownership Culture)
UK

The table below looks at the prevalence of the term Culture of Ownership in permanent job vacancies. Included is a benchmarking guide to the salaries offered in vacancies that have cited Culture of Ownership over the 6 months to 4 December 2023 with a comparison to the same period over the previous 2 years.

6 months to
4 Dec 2023
Same period 2022 Same period 2021
Rank 722 1004 189
Rank change year-on-year +282 -815 +555
Permanent jobs citing Culture of Ownership 19 72 2,655
As % of all permanent jobs advertised in the UK 0.036% 0.058% 2.07%
As % of the Miscellaneous category 0.097% 0.13% 4.70%
Number of salaries quoted 8 6 9
10th Percentile £80,625 £53,750 £40,850
25th Percentile £115,313 £55,000 £43,625
Median annual salary (50th Percentile) £125,000 £73,500 £80,000
Median % change year-on-year +70.07% -8.13% -36.00%
75th Percentile £129,375 £88,000 £82,500
90th Percentile £135,000 £90,625 £87,500
UK excluding London median annual salary £50,000 £60,000 £44,625
% change year-on-year -16.67% +34.45% -

All Generic Skills
UK

Culture of Ownership is in the General and Transferable Skills category. The following table is for comparison with the above and provides summary statistics for all permanent job vacancies with a requirement for generic IT skills.

Permanent vacancies with a requirement for generic IT skills 19,607 53,764 56,466
As % of all permanent jobs advertised in the UK 36.83% 43.38% 44.03%
Number of salaries quoted 14,348 29,746 33,691
10th Percentile £33,250 £34,875 £33,750
25th Percentile £45,000 £46,250 £45,000
Median annual salary (50th Percentile) £62,500 £63,500 £60,000
Median % change year-on-year -1.57% +5.83% -
75th Percentile £84,056 £85,000 £82,500
90th Percentile £107,500 £105,000 £100,000
UK excluding London median annual salary £55,000 £55,000 £50,000
% change year-on-year - +10.00% -

Culture of Ownership
Job Vacancy Trend

Job postings citing Culture of Ownership as a proportion of all IT jobs advertised.
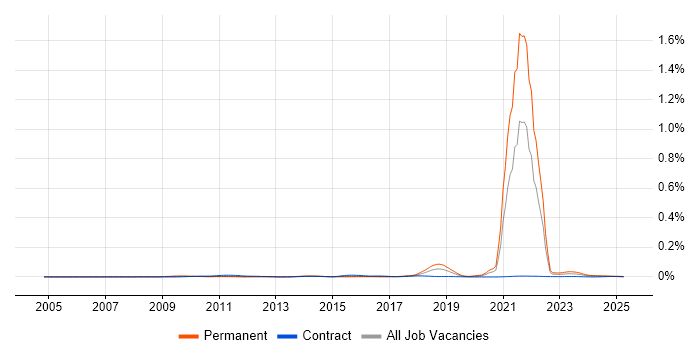
Job vacancy trend for Culture of Ownership in the UK

Culture of Ownership
Salary Trend

3-month moving average salary quoted in jobs citing Culture of Ownership.

Salary trend for Culture of Ownership in the UK

Culture of Ownership
Salary Histogram

Salary distribution for jobs citing Culture of Ownership over the 6 months to 4 December 2023.

Salary histogram for Culture of Ownership in the UK

Culture of Ownership
Top 7 Job Locations

The table below looks at the demand and provides a guide to the median salaries quoted in IT jobs citing Culture of Ownership within the UK over the 6 months to 4 December 2023. The 'Rank Change' column provides an indication of the change in demand within each location based on the same 6 month period last year.

Location Rank Change
on Same Period
Last Year
Matching
Permanent
IT Job Ads
Median Salary
Past 6 Months
Median Salary
% Change
on Same Period
Last Year
Live
Jobs
England +330 18 £125,000 +47.93% 1
London +265 17 £125,000 +42.86% 1
Work from Home +263 14 £130,000 +44.44% 1
UK excluding London +228 2 £50,000 -16.67% 1
North of England - 1 - -
North West - 1 - -
Wales - 1 £50,000 -

Culture of Ownership
Co-occurring Skills and Capabilities by Category

The follow tables expand on the table above by listing co-occurrences grouped by category. The same employment type, locality and period is covered with up to 20 co-occurrences shown in each of the following categories:

Application Platforms
1 4 (21.05%) Confluence
2 1 (5.26%) Exchange Server 2003
2 1 (5.26%) Exchange Server 2007
2 1 (5.26%) Exchange Server 2010
2 1 (5.26%) Exchange Server 2013
2 1 (5.26%) MS Exchange
2 1 (5.26%) SharePoint
2 1 (5.26%) Skype for Business
Cloud Services
1 13 (68.42%) AWS
2 10 (52.63%) GCP
Communications & Networking
1 1 (5.26%) Firewall
1 1 (5.26%) LAN
1 1 (5.26%) MPLS
1 1 (5.26%) TCP/IP
1 1 (5.26%) WAN
Development Applications
1 4 (21.05%) JIRA
General
1 10 (52.63%) Back Office
1 10 (52.63%) Finance
2 4 (21.05%) Health Technology
2 4 (21.05%) Pharmaceutical
3 1 (5.26%) Manufacturing
3 1 (5.26%) Publishing
3 1 (5.26%) Telecoms
Job Titles
1 10 (52.63%) Senior
1 10 (52.63%) Technology Strategist
2 2 (10.53%) Head of Engineering
3 1 (5.26%) Infrastructure Engineer
3 1 (5.26%) IT Engineer
3 1 (5.26%) IT Infrastructure Engineer
3 1 (5.26%) Lead
3 1 (5.26%) Principal Engineer
3 1 (5.26%) Product Engineer
3 1 (5.26%) Technical Leader
Libraries, Frameworks & Software Standards
1 1 (5.26%) Node.js
1 1 (5.26%) React
Miscellaneous
1 11 (57.89%) Data Centre
2 10 (52.63%) Blockchain
2 10 (52.63%) Cloud Native
2 10 (52.63%) Hybrid Cloud
2 10 (52.63%) Public Cloud
3 1 (5.26%) FMCG
3 1 (5.26%) Video Conferencing
Operating Systems
1 1 (5.26%) Windows
1 1 (5.26%) Windows 2000 Server
1 1 (5.26%) Windows Server
1 1 (5.26%) Windows Server 2003
1 1 (5.26%) Windows Server 2008
1 1 (5.26%) Windows Server 2012
1 1 (5.26%) Windows Server 2016
1 1 (5.26%) Windows Server 2019
Processes & Methodologies
1 16 (84.21%) Product Roadmap
1 16 (84.21%) Roadmaps
2 14 (73.68%) Continuous Improvement
3 13 (68.42%) Coaching
4 12 (63.16%) DevOps
4 12 (63.16%) Technical Leadership
5 11 (57.89%) IT Strategy
5 11 (57.89%) Mentoring
6 10 (52.63%) Analytics
6 10 (52.63%) Business Case
6 10 (52.63%) Collaborative Culture
6 10 (52.63%) Data Analytics
6 10 (52.63%) Economics
6 10 (52.63%) Edge Computing
6 10 (52.63%) Migration
6 10 (52.63%) Network Virtualisation
6 10 (52.63%) Technology Roadmap
6 10 (52.63%) Technology Strategy
6 10 (52.63%) Use Case
7 6 (31.58%) Artificial Intelligence
Programming Languages
1 6 (31.58%) C#
1 6 (31.58%) Python
2 5 (26.32%) TypeScript
3 4 (21.05%) Java
4 1 (5.26%) JavaScript
Qualifications
1 1 (5.26%) Cisco Certification
Quality Assurance & Compliance
1 1 (5.26%) Accessibility
System Software
1 1 (5.26%) Active Directory
Vendors
1 1 (5.26%) Cisco
1 1 (5.26%) Citrix
1 1 (5.26%) Google
1 1 (5.26%) Microsoft
1 1 (5.26%) VMware