
Continuous Improvement Job Trends in Warminster

Continual Improvement
Wiltshire > Warminster

The table below provides summary statistics and salary benchmarking for jobs advertised in Warminster requiring Continuous Improvement skills. It covers permanent job vacancies from the 6 months leading up to 9 August 2026, with comparisons to the same periods in the previous two years.

6 months to
9 Aug 2026
Same period 2025 Same period 2024
Rank 6 1 -
Rank change year-on-year -5 - -
Permanent jobs citing Continuous Improvement 12 1 0
As % of all permanent jobs in Warminster 20.00% 100.00% -
As % of the Processes & Methodologies category 26.09% 100.00% -
Number of salaries quoted 2 0 0
10th Percentile - - -
25th Percentile £85,000 - -
Median annual salary (50th Percentile) £90,000 - -
75th Percentile £95,000 - -
90th Percentile - - -
Wiltshire median annual salary £57,500 £40,000 £52,500
% change year-on-year +43.75% -23.81% -25.00%

All Process & Methodology Skills
Warminster

Continuous Improvement falls under the Processes and Methodologies category. For comparison with the information above, the following table provides summary statistics for all permanent job vacancies requiring process or methodology skills in Warminster.

Permanent vacancies with a requirement for process or methodology skills 46 1 2
As % of all permanent jobs advertised in Warminster 76.67% 100.00% 25.00%
Number of salaries quoted 10 0 1
10th Percentile £80,000 - -
25th Percentile £80,625 - £23,000
Median annual salary (50th Percentile) £86,250 - £24,000
Median % change year-on-year - - -46.67%
75th Percentile £95,000 - £25,000
90th Percentile £115,000 - -
Wiltshire median annual salary £52,500 £50,000 £50,500
% change year-on-year +5.00% -0.99% +1.00%

Continuous Improvement
Job Vacancy Trend in Warminster

Historical trend showing the proportion of permanent IT job postings citing Continuous Improvement relative to all permanent IT jobs advertised in Warminster.
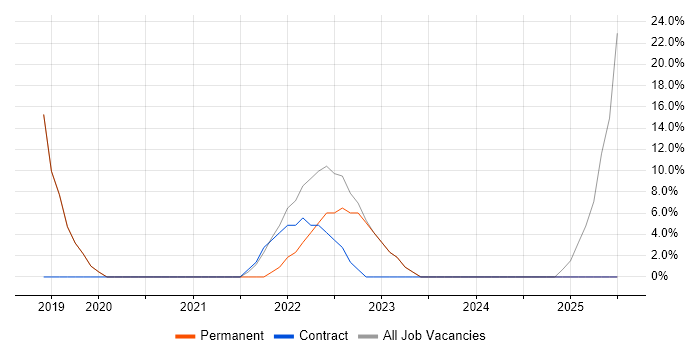
Continuous Improvement job vacancy trend in Warminster

Continuous Improvement
Salary Trend in Warminster

Salary distribution trend for jobs in Warminster citing Continuous Improvement.
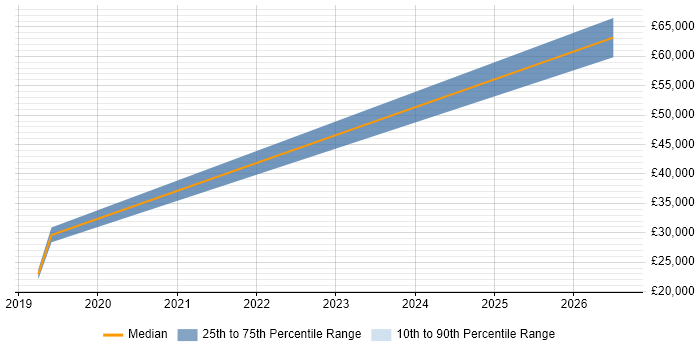
Salary distribution trend for jobs in Warminster citing Continuous Improvement

Continuous Improvement
Co-Occurring Skills & Capabilities in Warminster by Category

The following tables expand on the one above by listing co-occurrences grouped by category. They cover the same employment type, locality and period, with up to 20 co-occurrences shown in each category:

Applications
1 4 (33.33%) Microsoft Excel
1 4 (33.33%) Microsoft PowerPoint
1 4 (33.33%) Windchill
Cloud Services
1 7 (58.33%) GitHub
2 3 (25.00%) AWS
2 3 (25.00%) AWS CloudFormation
2 3 (25.00%) Azure
2 3 (25.00%) Azure DevOps
2 3 (25.00%) GitHub Actions
2 3 (25.00%) OpenShift
Database & Business Intelligence
1 3 (25.00%) Data Warehouse
1 3 (25.00%) ZAP BI
Development Applications
1 3 (25.00%) Cypress.io
1 3 (25.00%) GitLab
1 3 (25.00%) Jenkins
1 3 (25.00%) JUnit
1 3 (25.00%) NUnit
1 3 (25.00%) Postman
1 3 (25.00%) Selenium
1 3 (25.00%) Snyk
1 3 (25.00%) SonarQube
2 2 (16.67%) JIRA
2 2 (16.67%) Rational DOORS
General
1 10 (83.33%) Military
2 8 (66.67%) Social Skills
3 6 (50.00%) Environmental Health
3 6 (50.00%) Public Sector
4 2 (16.67%) Law
4 2 (16.67%) Organisational Skills
4 2 (16.67%) Presentation Skills
Job Titles
1 4 (33.33%) Configuration and Release Manager
1 4 (33.33%) Configuration Manager
1 4 (33.33%) Release and Configuration Manager
1 4 (33.33%) Release Manager
2 3 (25.00%) Developer
2 3 (25.00%) Software Developer
3 2 (16.67%) Principal Developer
3 2 (16.67%) Principal Software Developer
3 2 (16.67%) Programme Manager
3 2 (16.67%) QA Automation Engineer
3 2 (16.67%) QA Engineer
3 2 (16.67%) QA Test Engineer
3 2 (16.67%) Software QA Engineer
3 2 (16.67%) Software Test Engineer
3 2 (16.67%) Test Automation Engineer
3 2 (16.67%) Test Engineer
4 1 (8.33%) Security Architect
4 1 (8.33%) Senior
4 1 (8.33%) Senior Developer
4 1 (8.33%) Senior Software Developer
Libraries, Frameworks & Software Standards
1 3 (25.00%) .NET
1 3 (25.00%) .NET Core
1 3 (25.00%) AngularJS
1 3 (25.00%) Elastic Stack
1 3 (25.00%) Keycloak
1 3 (25.00%) Node.js
1 3 (25.00%) pytest
1 3 (25.00%) React
1 3 (25.00%) RESTful
2 2 (16.67%) JSP
Miscellaneous
1 3 (25.00%) Cloud Native
1 3 (25.00%) Legacy Systems
2 2 (16.67%) Enterprise Software
3 1 (8.33%) Management Information System
Processes & Methodologies
1 12 (100.00%) Agile
2 10 (83.33%) Matrix Organization
3 8 (66.67%) Collaborative Culture
3 8 (66.67%) Scaled Agile Framework
4 7 (58.33%) ITIL
4 7 (58.33%) Software Engineering
5 6 (50.00%) Stakeholder Engagement
5 6 (50.00%) Systems Thinking
6 5 (41.67%) DevOps
6 5 (41.67%) Test Automation
7 4 (33.33%) CMMI
7 4 (33.33%) Configuration Management
7 4 (33.33%) Data Management
7 4 (33.33%) Release Management
7 4 (33.33%) Technical Leadership
8 3 (25.00%) Code Quality
8 3 (25.00%) Dynamic Code Analysis
8 3 (25.00%) End-to-End Testing
8 3 (25.00%) Performance Optimisation
8 3 (25.00%) Roadmaps
Programming Languages
1 5 (41.67%) Java
1 5 (41.67%) JavaScript
1 5 (41.67%) Python
2 3 (25.00%) Go
3 2 (16.67%) Bash
Qualifications
1 12 (100.00%) Security Cleared
2 11 (91.67%) SC Cleared
3 8 (66.67%) Degree
4 6 (50.00%) PMI Certification
4 6 (50.00%) PMP
5 3 (25.00%) OCP
5 3 (25.00%) Oracle Certification
6 1 (8.33%) BPSS Clearance
6 1 (8.33%) CISM
6 1 (8.33%) CISSP
6 1 (8.33%) CRISC
Quality Assurance & Compliance
1 8 (66.67%) QA
2 4 (33.33%) Def Stans
2 4 (33.33%) ISO 9000
2 4 (33.33%) ISO/IEC 15288
2 4 (33.33%) NIST
3 1 (8.33%) ISO/IEC 27001
System Software
1 3 (25.00%) Docker
Systems Management
1 3 (25.00%) Grafana
1 3 (25.00%) Kubernetes
1 3 (25.00%) Prometheus
1 3 (25.00%) Terraform
Vendors
1 4 (33.33%) Microsoft
2 3 (25.00%) Red Hat
3 2 (16.67%) IBM
4 1 (8.33%) Oracle