Mentoring Jobs in London

Mentorship
England > London

The table below provides summary statistics for permanent job vacancies advertised in London requiring Mentoring skills. It includes a benchmarking guide to the annual salaries offered in vacancies that cited Mentoring over the 6 months leading up to 31 October 2024, comparing them to the same period in the previous two years.

6 months to
31 Oct 2024
Same period 2023 Same period 2022
Rank 25 34 28
Rank change year-on-year +9 -6 +11
Permanent jobs citing Mentoring 1,546 1,358 5,064
As % of all permanent jobs advertised in London 8.23% 6.79% 9.10%
As % of the Processes & Methodologies category 9.05% 7.24% 9.45%
Number of salaries quoted 580 928 1,978
10th Percentile £54,881 £47,925 £50,000
25th Percentile £65,000 £61,438 £62,231
Median annual salary (50th Percentile) £80,000 £82,500 £80,000
Median % change year-on-year -3.03% +3.13% +6.67%
75th Percentile £106,250 £97,750 £100,000
90th Percentile £125,000 £115,000 £117,500
England median annual salary £65,000 £67,500 £66,911
% change year-on-year -3.70% +0.88% +2.94%

All Process and Methodology Skills
London

Mentoring falls under the Processes and Methodologies category. For comparison with the information above, the following table provides summary statistics for all permanent job vacancies requiring process or methodology skills in London.

Permanent vacancies with a requirement for process or methodology skills 17,074 18,750 53,604
As % of all permanent jobs advertised in London 90.85% 93.75% 96.36%
Number of salaries quoted 9,308 15,050 32,369
10th Percentile £42,500 £41,500 £42,500
25th Percentile £56,250 £55,000 £55,000
Median annual salary (50th Percentile) £75,000 £75,000 £72,500
Median % change year-on-year - +3.45% +3.57%
75th Percentile £97,500 £95,000 £92,500
90th Percentile £120,000 £116,250 £112,500
England median annual salary £60,000 £60,000 £60,000
% change year-on-year - - +3.45%

Mentoring
Job Vacancy Trend in London

Job postings citing Mentoring as a proportion of all IT jobs advertised in London.
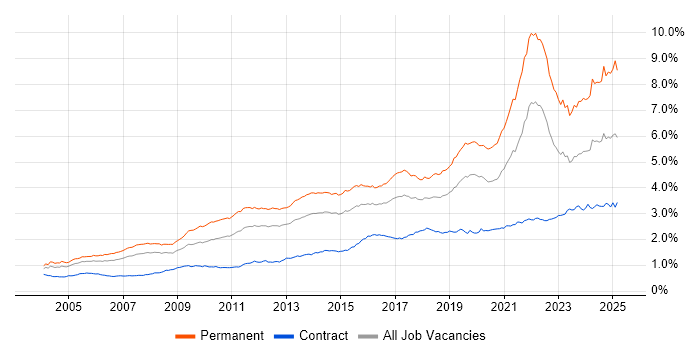
Job vacancy trend for Mentoring in London

Mentoring
Salary Trend in London

3-month moving average salary quoted in jobs citing Mentoring in London.

Salary trend for Mentoring in London

Mentoring
Salary Histogram in London

Salary distribution for jobs citing Mentoring in London over the 6 months to 31 October 2024.

Salary histogram for Mentoring in London

Mentoring
Job Locations in London

The table below looks at the demand and provides a guide to the median salaries quoted in IT jobs citing Mentoring within the London region over the 6 months to 31 October 2024. The 'Rank Change' column provides an indication of the change in demand within each location based on the same 6 month period last year.

Location Rank Change
on Same Period
Last Year
Matching
Permanent
IT Job Ads
Median Salary
Past 6 Months
Median Salary
% Change
on Same Period
Last Year
Live
Jobs
Central London 0 275 £77,500 -3.13% 57
South London -12 41 £58,265 +14.36% 8
West London -1 34 £72,500 +21.85% 19
East London +27 14 £80,000 +113.33% 16
North London +5 4 - - 2
Mentoring
England

Mentoring
Co-occurring Skills and Capabilities in London by Category

The follow tables expand on the table above by listing co-occurrences grouped by category. The same employment type, locality and period is covered with up to 20 co-occurrences shown in each of the following categories:

Application Platforms
1 43 (2.78%) Apache
2 41 (2.65%) Apache Airflow
3 18 (1.16%) SharePoint
4 16 (1.03%) Confluence
5 15 (0.97%) Microsoft Exchange
6 12 (0.78%) Apache Spark
7 11 (0.71%) CMS
8 9 (0.58%) nginx
9 8 (0.52%) Apache Solr
10 3 (0.19%) Oracle Workflow
10 3 (0.19%) WordPress
11 2 (0.13%) OpenEdge
12 1 (0.065%) Apache Pulsar
12 1 (0.065%) Camunda
12 1 (0.065%) Documentum
Applications
1 36 (2.33%) Microsoft Excel
2 32 (2.07%) Microsoft Office
3 15 (0.97%) Chatbot
4 7 (0.45%) MS Visio
5 6 (0.39%) Microsoft Project
6 5 (0.32%) Photoshop
7 4 (0.26%) Trello
8 2 (0.13%) Microsoft PowerPoint
9 1 (0.065%) Adobe XD
9 1 (0.065%) OrCAD
9 1 (0.065%) Sketch
Business Applications
1 29 (1.88%) Ripple
2 17 (1.10%) Dynamics CRM
3 10 (0.65%) Unit4 Business World
4 8 (0.52%) NEC Housing
5 5 (0.32%) SDL Web 8
6 4 (0.26%) Endur
7 3 (0.19%) Findur
7 3 (0.19%) Oracle Cash Management
7 3 (0.19%) Oracle EBS
7 3 (0.19%) Oracle EBS R12
7 3 (0.19%) Oracle E-Business Tax
7 3 (0.19%) Oracle General Ledger
7 3 (0.19%) Oracle Internet Expenses
7 3 (0.19%) Oracle iProcurement
7 3 (0.19%) Oracle Payables
7 3 (0.19%) Oracle Receivables
7 3 (0.19%) SAP HR
8 2 (0.13%) Cerner Millennium
8 2 (0.13%) SAP S/4HANA
8 2 (0.13%) SimCorp Dimension
Cloud Services
1 343 (22.19%) AWS
2 312 (20.18%) Azure
3 206 (13.32%) GCP
4 86 (5.56%) Power Platform
5 60 (3.88%) Serverless
6 59 (3.82%) Amazon ECS
7 55 (3.56%) Cloud Computing
8 52 (3.36%) Amazon EKS
9 50 (3.23%) Amazon S3
9 50 (3.23%) Microsoft 365
10 49 (3.17%) dbt
11 48 (3.10%) Snowflake
12 45 (2.91%) SaaS
13 44 (2.85%) Amazon EC2
13 44 (2.85%) AWS Lambda
14 38 (2.46%) Azure DevOps
15 18 (1.16%) Amazon SQS
15 18 (1.16%) IaaS
16 17 (1.10%) Azure Data Factory
16 17 (1.10%) GitHub
Communications & Networking
1 248 (16.04%) Broadband
2 74 (4.79%) Intrusion Detection
3 61 (3.95%) Firewall
4 37 (2.39%) Network Security
5 32 (2.07%) DNS
6 31 (2.01%) DHCP
7 29 (1.88%) Wi-Fi
8 24 (1.55%) Internet
9 23 (1.49%) LAN
10 22 (1.42%) Unified Communications
11 21 (1.36%) WAN
12 20 (1.29%) Structured Cabling
13 18 (1.16%) VoIP
14 16 (1.03%) Wireless
15 15 (0.97%) TCP/IP
16 14 (0.91%) VPN
17 13 (0.84%) SD-WAN
18 9 (0.58%) 4G
19 6 (0.39%) Cisco ASA
19 6 (0.39%) Cisco ISE
Database & Business Intelligence
1 114 (7.37%) MongoDB
2 101 (6.53%) MySQL
3 91 (5.89%) Relational Database
4 67 (4.33%) Power BI
5 59 (3.82%) SQL Server
6 58 (3.75%) Data Lake
7 50 (3.23%) Data Warehouse
8 49 (3.17%) NoSQL
9 42 (2.72%) Amazon Athena
10 35 (2.26%) Apache Ignite
10 35 (2.26%) PostgreSQL
11 32 (2.07%) Apache Arrow
11 32 (2.07%) Dremio
12 31 (2.01%) Tableau
13 26 (1.68%) Qlik Sense
14 23 (1.49%) Big Data
15 17 (1.10%) Amazon Redshift
16 16 (1.03%) Hadoop
17 15 (0.97%) Amazon RDS
17 15 (0.97%) SQL Server Integration Services
Development Applications
1 138 (8.93%) Git
2 98 (6.34%) GitLab
3 37 (2.39%) Jenkins
4 36 (2.33%) JIRA
5 14 (0.91%) Maven
6 9 (0.58%) Octopus Deploy
6 9 (0.58%) TeamCity
7 7 (0.45%) SonarQube
8 6 (0.39%) Crucible
8 6 (0.39%) Cypress.io
8 6 (0.39%) git-flow
8 6 (0.39%) Moq
8 6 (0.39%) Robot Framework
8 6 (0.39%) Selenium
8 6 (0.39%) SpecFlow
9 5 (0.32%) Cucumber
9 5 (0.32%) Gradle
9 5 (0.32%) NUnit
9 5 (0.32%) Sonatype Nexus
9 5 (0.32%) Sourcetree
General
1 679 (43.92%) Social Skills
2 541 (34.99%) Finance
3 334 (21.60%) Analytical Skills
4 187 (12.10%) Inclusion and Diversity
5 120 (7.76%) Banking
6 106 (6.86%) Legal
7 95 (6.14%) Law
8 92 (5.95%) Telecoms
9 71 (4.59%) Marketing
10 56 (3.62%) Presentation Skills
11 54 (3.49%) Retail
12 48 (3.10%) Manufacturing
13 42 (2.72%) Influencing Skills
14 40 (2.59%) Investment Banking
15 39 (2.52%) Front Office
16 37 (2.39%) Organisational Skills
17 36 (2.33%) Financial Institution
18 35 (2.26%) Public Sector
19 32 (2.07%) French Language
19 32 (2.07%) German Language
Job Titles
1 400 (25.87%) Lead
2 366 (23.67%) Senior
3 172 (11.13%) Architect
4 149 (9.64%) Developer
5 129 (8.34%) Team Leader
6 119 (7.70%) Software Engineer
7 114 (7.37%) Senior Manager
8 110 (7.12%) Technical Manager
9 91 (5.89%) Audit Manager
10 89 (5.76%) Product Manager
11 81 (5.24%) Technical Product Manager
12 64 (4.14%) Security Architect
13 61 (3.95%) Consultant
14 60 (3.88%) Python Engineer
15 55 (3.56%) Quality Manager
16 51 (3.30%) Analyst
16 51 (3.30%) Senior Developer
17 49 (3.17%) Senior Audit Manager
18 46 (2.98%) Solutions Architect
19 45 (2.91%) Lead Software Engineer
Libraries, Frameworks & Software Standards
1 136 (8.80%) HTML
2 121 (7.83%) React
3 115 (7.44%) Elastic Stack
4 82 (5.30%) .NET
5 78 (5.05%) RESTful
6 60 (3.88%) Node.js
7 45 (2.91%) PySpark
8 43 (2.78%) CSS
9 42 (2.72%) Spring
10 40 (2.59%) Django
11 37 (2.39%) AngularJS
12 36 (2.33%) Kafka
13 35 (2.26%) REST
14 33 (2.13%) Pandas
15 32 (2.07%) gRPC
15 32 (2.07%) NumPy
15 32 (2.07%) Protocol Buffers
15 32 (2.07%) SciPy
16 31 (2.01%) Web Services
17 27 (1.75%) XML
Miscellaneous
1 136 (8.80%) Management Information System
2 121 (7.83%) Private Cloud
3 118 (7.63%) Product Ownership
4 117 (7.57%) Cloud Native
5 93 (6.02%) Cyberattack
6 58 (3.75%) Blockchain
7 52 (3.36%) Derivative
7 52 (3.36%) Foreign Exchange (FX)
8 45 (2.91%) Virtual Team
9 43 (2.78%) Onboarding
10 42 (2.72%) Hedge funds
11 36 (2.33%) Public Cloud
12 34 (2.20%) Equities
12 34 (2.20%) Fixed Income
13 30 (1.94%) Data Structures
14 26 (1.68%) e-Learning
14 26 (1.68%) Self-Motivation
15 25 (1.62%) Video Conferencing
16 24 (1.55%) Greenfield Project
17 23 (1.49%) Data Centre
Operating Systems
1 179 (11.58%) Linux
2 79 (5.11%) Windows
3 30 (1.94%) Windows Server
4 18 (1.16%) Apple iOS
4 18 (1.16%) Unix
5 16 (1.03%) Android
6 13 (0.84%) Windows 10
7 8 (0.52%) CentOS
7 8 (0.52%) Ubuntu
7 8 (0.52%) Windows Server 2019
8 4 (0.26%) Mac OS
8 4 (0.26%) Red Hat Enterprise Linux
9 3 (0.19%) Windows 7
9 3 (0.19%) Windows Server 2012
10 1 (0.065%) Amazon Linux
10 1 (0.065%) CoreOS
10 1 (0.065%) Embedded Linux
10 1 (0.065%) Windows 8
Processes & Methodologies
1 479 (30.98%) Agile
2 454 (29.37%) Problem-Solving
3 424 (27.43%) DevOps
4 365 (23.61%) CI/CD
5 359 (23.22%) Coaching
6 325 (21.02%) Software Engineering
7 282 (18.24%) Continuous Improvement
8 276 (17.85%) Continuous Integration
9 239 (15.46%) Roadmaps
10 228 (14.75%) Computer Science
11 218 (14.10%) Configuration Management
12 186 (12.03%) Creative Thinking
13 182 (11.77%) Microservices
14 175 (11.32%) Containerisation
15 148 (9.57%) Stakeholder Management
16 147 (9.51%) Cybersecurity
17 146 (9.44%) Observability
18 143 (9.25%) Artificial Intelligence
18 143 (9.25%) Site Reliability Engineering
19 139 (8.99%) Risk Management
Programming Languages
1 362 (23.42%) Python
2 199 (12.87%) SQL
3 160 (10.35%) Java
4 152 (9.83%) JavaScript
5 133 (8.60%) Bash
6 119 (7.70%) Shell Script
7 105 (6.79%) TypeScript
8 82 (5.30%) C#
9 42 (2.72%) PowerShell
10 27 (1.75%) VBA
11 24 (1.55%) Rust
12 21 (1.36%) Kotlin
13 19 (1.23%) T-SQL
14 17 (1.10%) Go
15 16 (1.03%) C++
16 15 (0.97%) Solidity
17 13 (0.84%) R
18 11 (0.71%) Scala
19 9 (0.58%) Apex Code
19 9 (0.58%) Bicep
Qualifications
1 364 (23.54%) Degree
2 179 (11.58%) Master's Degree
3 177 (11.45%) Computer Science Degree
4 176 (11.38%) Security Cleared
5 121 (7.83%) LPIC
6 113 (7.31%) RHCSA
7 102 (6.60%) DV Cleared
8 55 (3.56%) SC Cleared
9 52 (3.36%) CISA
10 42 (2.72%) Cisco Certification
11 30 (1.94%) AWS Certification
12 27 (1.75%) CISSP
13 26 (1.68%) ACCA
13 26 (1.68%) CCAB
14 22 (1.42%) CFA
15 21 (1.36%) Azure Certification
15 21 (1.36%) RIBA
16 18 (1.16%) CCNA
16 18 (1.16%) CISM
17 17 (1.10%) PhD
Quality Assurance & Compliance
1 221 (14.29%) QA
2 125 (8.09%) NIST
3 118 (7.63%) SOC 2
4 38 (2.46%) ITGC
5 35 (2.26%) Accessibility
6 28 (1.81%) IFRS
7 27 (1.75%) GAAP
8 26 (1.68%) Data Quality
8 26 (1.68%) SLA
9 17 (1.10%) GDPR
10 16 (1.03%) GMP
11 10 (0.65%) IFRS 17
11 10 (0.65%) IFRS 9
11 10 (0.65%) ISO/IEC 27001
12 8 (0.52%) PMO
13 7 (0.45%) Sarbanes-Oxley
14 6 (0.39%) Good Clinical Practice
15 5 (0.32%) PCI DSS
16 4 (0.26%) Cyber Essentials
16 4 (0.26%) WCAG
System Software
1 297 (19.21%) Docker
2 51 (3.30%) Active Directory
3 38 (2.46%) VMware Infrastructure
4 12 (0.78%) vSphere
5 8 (0.52%) Virtual Machines
5 8 (0.52%) VMware NSX
6 7 (0.45%) Virtual Desktop
7 5 (0.32%) VMware Server
8 4 (0.26%) XenApp
8 4 (0.26%) XenDesktop
9 2 (0.13%) Hyper-V
9 2 (0.13%) Virtual Servers
9 2 (0.13%) VMware Workstation
10 1 (0.065%) Apache Flume
Systems Management
1 197 (12.74%) Kubernetes
2 151 (9.77%) Ansible
3 134 (8.67%) Prometheus
4 129 (8.34%) Grafana
5 88 (5.69%) Terraform
6 23 (1.49%) Microsoft Intune
7 14 (0.91%) FortiGate
7 14 (0.91%) Packer
8 11 (0.71%) Progress Chef
9 10 (0.65%) Puppet
9 10 (0.65%) SCCM
10 9 (0.58%) Nagios
11 8 (0.52%) QRadar
12 6 (0.39%) Single Sign-On
12 6 (0.39%) vCenter Server
13 5 (0.32%) Istio
14 4 (0.26%) CASB
14 4 (0.26%) CSIRT
15 3 (0.19%) Active Directory Federation Services
15 3 (0.19%) Nmap
Vendors
1 206 (13.32%) Microsoft
2 91 (5.89%) Google
3 45 (2.91%) SAP
3 45 (2.91%) VMware
4 42 (2.72%) Cisco
5 40 (2.59%) Salesforce
6 37 (2.39%) Databricks
6 37 (2.39%) Oracle
7 32 (2.07%) Red Hat
8 22 (1.42%) IBM
9 20 (1.29%) ServiceNow
10 15 (0.97%) Palo Alto
11 14 (0.91%) Dynatrace
12 11 (0.71%) Adobe
12 11 (0.71%) Citrix
13 10 (0.65%) Apple
13 10 (0.65%) Sage
14 9 (0.58%) Dell
15 8 (0.52%) NEC
16 7 (0.45%) Zscaler