Inclusion and Diversity Jobs in London

Inclusion and Diversity
England > London

The table below looks at the prevalence of the term Inclusion and Diversity in permanent job vacancies in London. Included is a benchmarking guide to the salaries offered in vacancies that cited Inclusion and Diversity over the 6 months leading up to 31 October 2024, comparing them to the same period in the previous two years.

6 months to
31 Oct 2024
Same period 2023 Same period 2022
Rank 35 36 33
Rank change year-on-year +1 -3 +202
Permanent jobs citing Inclusion and Diversity 1,183 1,302 4,514
As % of all permanent jobs advertised in London 6.29% 6.51% 8.11%
As % of the General category 8.95% 9.52% 11.36%
Number of salaries quoted 396 797 1,806
10th Percentile £46,713 £45,000 £40,000
25th Percentile £56,250 £60,000 £53,004
Median annual salary (50th Percentile) £70,000 £75,000 £70,000
Median % change year-on-year -6.67% +7.14% +21.74%
75th Percentile £89,063 £95,000 £85,000
90th Percentile £107,500 £110,000 £100,000
England median annual salary £65,000 £70,000 £60,000
% change year-on-year -7.14% +16.67% +12.56%

All General Skills
London

Inclusion and Diversity falls under the General Skills category. For comparison with the information above, the following table provides summary statistics for all permanent job vacancies requiring common skills in London.

Permanent vacancies with a requirement for common skills 13,218 13,674 39,730
As % of all permanent jobs advertised in London 70.33% 68.37% 71.42%
Number of salaries quoted 7,016 10,565 23,166
10th Percentile £41,250 £40,000 £41,250
25th Percentile £55,000 £55,000 £53,250
Median annual salary (50th Percentile) £75,000 £75,000 £72,500
Median % change year-on-year - +3.45% +3.57%
75th Percentile £97,500 £95,000 £93,750
90th Percentile £122,500 £120,000 £115,000
England median annual salary £60,000 £60,000 £60,000
% change year-on-year - - +1.69%

Inclusion and Diversity
Job Vacancy Trend in London

Job postings citing Inclusion and Diversity as a proportion of all IT jobs advertised in London.
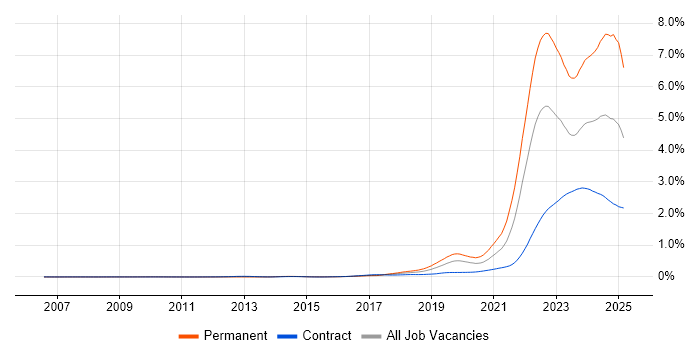
Job vacancy trend for Inclusion and Diversity in London

Inclusion and Diversity
Salary Trend in London

3-month moving average salary quoted in jobs citing Inclusion and Diversity in London.

Salary trend for Inclusion and Diversity in London

Inclusion and Diversity
Salary Histogram in London

Salary distribution for jobs citing Inclusion and Diversity in London over the 6 months to 31 October 2024.

Salary histogram for Inclusion and Diversity in London

Inclusion and Diversity
Job Locations in London

The table below looks at the demand and provides a guide to the median salaries quoted in IT jobs citing Inclusion and Diversity within the London region over the 6 months to 31 October 2024. The 'Rank Change' column provides an indication of the change in demand within each location based on the same 6 month period last year.

Location Rank Change
on Same Period
Last Year
Matching
Permanent
IT Job Ads
Median Salary
Past 6 Months
Median Salary
% Change
on Same Period
Last Year
Live
Jobs
Central London +94 202 £70,000 +7.69% 23
West London +26 91 - - 8
South London +33 85 £36,547 -32.32% 4
East London - 26 £53,046 - 9
North London +20 24 £53,046 +67.60%
Inclusion and Diversity
England

Inclusion and Diversity
Co-occurring Skills and Capabilities in London by Category

The follow tables expand on the table above by listing co-occurrences grouped by category. The same employment type, locality and period is covered with up to 20 co-occurrences shown in each of the following categories:

Application Platforms
1 41 (3.47%) SharePoint
2 24 (2.03%) Apache Spark
3 12 (1.01%) CMS
4 9 (0.76%) Confluence
5 8 (0.68%) Microsoft Exchange
6 6 (0.51%) Apache
6 6 (0.51%) Apache Airflow
7 4 (0.34%) Apache Pulsar
7 4 (0.34%) Camunda
8 3 (0.25%) Oracle Workflow
9 1 (0.085%) Adobe Experience Manager
9 1 (0.085%) Magnolia
9 1 (0.085%) nginx
9 1 (0.085%) WordPress
Applications
1 56 (4.73%) Microsoft Excel
2 36 (3.04%) Microsoft Office
3 32 (2.70%) Microsoft PowerPoint
4 30 (2.54%) Adobe Premiere
5 29 (2.45%) InDesign
6 27 (2.28%) Photoshop
7 26 (2.20%) Adobe Illustrator
8 24 (2.03%) Adobe After Effects
9 3 (0.25%) Adobe Creative Suite
10 2 (0.17%) Microsoft Project
10 2 (0.17%) Trello
11 1 (0.085%) SPSS
Business Applications
1 15 (1.27%) Ripple
2 11 (0.93%) Endur
3 10 (0.85%) Unit4 Business World
4 7 (0.59%) Dynamics CRM
5 6 (0.51%) Maximo
6 3 (0.25%) NEC Housing
6 3 (0.25%) Oracle Cash Management
6 3 (0.25%) Oracle EBS
6 3 (0.25%) Oracle EBS R12
6 3 (0.25%) Oracle E-Business Tax
6 3 (0.25%) Oracle General Ledger
6 3 (0.25%) Oracle Internet Expenses
6 3 (0.25%) Oracle iProcurement
6 3 (0.25%) Oracle Payables
6 3 (0.25%) Oracle Receivables
7 2 (0.17%) thinkFolio
8 1 (0.085%) Dynamics GP
8 1 (0.085%) Oracle ERP
8 1 (0.085%) Remedy ITSM
8 1 (0.085%) SAP SD
Cloud Services
1 287 (24.26%) AWS
2 196 (16.57%) Azure
3 130 (10.99%) GCP
4 106 (8.96%) Amazon S3
5 103 (8.71%) Serverless
6 102 (8.62%) Power Platform
7 95 (8.03%) AWS Lambda
8 94 (7.95%) Amazon SQS
9 91 (7.69%) GitHub
10 88 (7.44%) Amazon Kinesis
11 80 (6.76%) Amazon CloudWatch
12 64 (5.41%) Cloud Computing
13 39 (3.30%) SaaS
14 30 (2.54%) Microsoft 365
15 25 (2.11%) Adobe Creative Cloud
16 24 (2.03%) dbt
17 23 (1.94%) Azure Data Factory
17 23 (1.94%) Azure Synapse Analytics
18 17 (1.44%) Amazon EKS
18 17 (1.44%) Power Automate
Communications & Networking
1 129 (10.90%) Broadband
2 69 (5.83%) Intrusion Detection
3 31 (2.62%) Intranet
4 27 (2.28%) Network Security
5 22 (1.86%) HTTP
6 15 (1.27%) Unified Communications
7 13 (1.10%) Firewall
8 11 (0.93%) DNS
9 10 (0.85%) DHCP
10 7 (0.59%) 5G
10 7 (0.59%) Wi-Fi
11 6 (0.51%) Internet
11 6 (0.51%) TCP/IP
12 4 (0.34%) NAS
12 4 (0.34%) PSTN
12 4 (0.34%) VPN
12 4 (0.34%) WebEx
13 3 (0.25%) Modbus
13 3 (0.25%) MQTT
13 3 (0.25%) Structured Cabling
Database & Business Intelligence
1 112 (9.47%) PostgreSQL
2 97 (8.20%) Power BI
3 96 (8.11%) Redis
4 91 (7.69%) DynamoDB
5 88 (7.44%) MySQL
6 42 (3.55%) Data Warehouse
7 30 (2.54%) SQL Server
8 28 (2.37%) Tableau
9 26 (2.20%) Qlik Sense
9 26 (2.20%) Relational Database
10 24 (2.03%) Data Lake
11 23 (1.94%) Metadata
12 15 (1.27%) NoSQL
13 13 (1.10%) Amazon RDS
13 13 (1.10%) BigQuery
14 11 (0.93%) DB2
14 11 (0.93%) Elasticsearch
14 11 (0.93%) SQL Server Reporting Services
15 8 (0.68%) SQL Server Integration Services
16 6 (0.51%) Power Query
Development Applications
1 95 (8.03%) Jenkins
2 41 (3.47%) Git
3 16 (1.35%) Artifactory
3 16 (1.35%) JIRA
4 10 (0.85%) TeamCity
5 9 (0.76%) webpack
6 6 (0.51%) Cypress.io
6 6 (0.51%) MSBuild
6 6 (0.51%) Team Foundation Server
7 5 (0.42%) Selenium
8 4 (0.34%) GitLab
8 4 (0.34%) Grunt
8 4 (0.34%) Jasmine
8 4 (0.34%) Mocha
9 3 (0.25%) Appium
9 3 (0.25%) MSI
9 3 (0.25%) Terragrunt
9 3 (0.25%) Toad
9 3 (0.25%) WebDriver
10 2 (0.17%) ERwin
General
1 425 (35.93%) Finance
2 375 (31.70%) Social Skills
3 229 (19.36%) Analytical Skills
4 149 (12.60%) Marketing
5 141 (11.92%) Advertising
6 132 (11.16%) Banking
7 126 (10.65%) Law
8 111 (9.38%) Retail
9 68 (5.75%) Legal
10 64 (5.41%) Telecoms
11 62 (5.24%) Retail Banking
12 50 (4.23%) Public Sector
13 47 (3.97%) Financial Institution
13 47 (3.97%) Presentation Skills
14 28 (2.37%) Games
14 28 (2.37%) Influencing Skills
15 27 (2.28%) Organisational Skills
16 19 (1.61%) Back Office
17 14 (1.18%) French Language
17 14 (1.18%) German Language
Job Titles
1 258 (21.81%) Analyst
2 231 (19.53%) Senior
3 182 (15.38%) Architect
4 159 (13.44%) Software Engineer
5 98 (8.28%) Lead
6 85 (7.19%) Operations Analyst
7 79 (6.68%) Service Analyst
8 78 (6.59%) Service Operations Analyst
9 65 (5.49%) Security Architect
10 57 (4.82%) Business Analyst
11 55 (4.65%) Senior Manager
12 52 (4.40%) Developer
13 50 (4.23%) Senior Architect
14 49 (4.14%) Data Engineer
15 43 (3.63%) Solutions Architect
16 40 (3.38%) Project Manager
17 36 (3.04%) Product Manager
18 35 (2.96%) Azure Engineer
19 34 (2.87%) Senior Software Engineer
20 31 (2.62%) Azure Data Engineer
Libraries, Frameworks & Software Standards
1 137 (11.58%) React
2 119 (10.06%) Node.js
3 116 (9.81%) HTML
4 101 (8.54%) AngularJS
5 99 (8.37%) REST
6 92 (7.78%) Tailwind CSS
7 49 (4.14%) .NET
8 31 (2.62%) CSS
8 31 (2.62%) Kafka
9 23 (1.94%) EDI
10 22 (1.86%) .NET Framework
11 21 (1.78%) RESTful
12 20 (1.69%) .NET Core
12 20 (1.69%) Spring
13 19 (1.61%) Django
14 16 (1.35%) PySpark
15 15 (1.27%) GraphQL
16 13 (1.10%) ASP.NET
16 13 (1.10%) OAuth
16 13 (1.10%) Spring Boot
Miscellaneous
1 113 (9.55%) Blog
2 101 (8.54%) Cyberattack
3 96 (8.11%) Digital Media
4 93 (7.86%) Management Information System
5 82 (6.93%) Onboarding
6 72 (6.09%) Cloud Native
6 72 (6.09%) Product Ownership
7 43 (3.63%) Public Cloud
8 36 (3.04%) Distributed Systems
9 35 (2.96%) Social Media
10 27 (2.28%) Blockchain
11 24 (2.03%) Greenfield Project
11 24 (2.03%) Video Editing
12 22 (1.86%) Virtual Team
13 19 (1.61%) Data Structures
14 15 (1.27%) Hybrid Cloud
15 14 (1.18%) Credit Risk
15 14 (1.18%) Fixed Income
15 14 (1.18%) Reinsurance
15 14 (1.18%) Self-Motivation
Operating Systems
1 53 (4.48%) Windows
2 32 (2.70%) Linux
3 24 (2.03%) Unix
4 17 (1.44%) Windows Server
5 11 (0.93%) Mac OS
6 10 (0.85%) Ubuntu
7 7 (0.59%) Android
8 6 (0.51%) Apple iOS
9 2 (0.17%) Windows 10
10 1 (0.085%) Alpine Linux
10 1 (0.085%) VMS
10 1 (0.085%) Windows Server 2012
Processes & Methodologies
1 480 (40.57%) Agile
2 265 (22.40%) Problem-Solving
3 198 (16.74%) Software Engineering
4 187 (15.81%) Mentoring
5 172 (14.54%) DevOps
6 161 (13.61%) Cybersecurity
7 160 (13.52%) Risk Management
8 149 (12.60%) Service Management
8 149 (12.60%) Stakeholder Management
9 136 (11.50%) User Experience
10 126 (10.65%) Scrum
11 118 (9.97%) Analytics
11 118 (9.97%) Information Security
12 116 (9.81%) Continuous Delivery
13 112 (9.47%) Artificial Intelligence
14 110 (9.30%) Full-Stack Development
15 107 (9.04%) ITIL
16 102 (8.62%) Data Analysis
17 101 (8.54%) E-Commerce
18 99 (8.37%) Service Delivery
Programming Languages
1 230 (19.44%) SQL
2 179 (15.13%) Python
3 107 (9.04%) TypeScript
4 74 (6.26%) JavaScript
5 62 (5.24%) Java
6 60 (5.07%) C#
7 31 (2.62%) VBA
8 24 (2.03%) PowerShell
9 23 (1.94%) Go
9 23 (1.94%) Scala
10 21 (1.78%) Bash
11 13 (1.10%) Kotlin
12 11 (0.93%) C++
13 9 (0.76%) R
13 9 (0.76%) Ruby
13 9 (0.76%) Shell Script
14 7 (0.59%) Data Analysis Expressions
15 6 (0.51%) T-SQL
15 6 (0.51%) VB.NET
16 5 (0.42%) C
Qualifications
1 165 (13.95%) Degree
2 160 (13.52%) Security Cleared
3 106 (8.96%) DV Cleared
4 54 (4.56%) SC Cleared
5 51 (4.31%) CISA
6 44 (3.72%) Master's Degree
7 34 (2.87%) AWS Certification
8 27 (2.28%) ACCA
9 26 (2.20%) CCAB
10 25 (2.11%) DBS Check
11 24 (2.03%) CISSP
12 21 (1.78%) Cisco Certification
13 19 (1.61%) CCNA
13 19 (1.61%) Computer Science Degree
14 17 (1.44%) CCNP
15 16 (1.35%) CEH
16 15 (1.27%) CRISC
17 14 (1.18%) CFA
18 13 (1.10%) Azure Certification
19 12 (1.01%) Microsoft Certification
Quality Assurance & Compliance
1 48 (4.06%) QA
2 36 (3.04%) ITGC
3 28 (2.37%) Data Quality
4 27 (2.28%) Accessibility
5 19 (1.61%) IFRS
6 16 (1.35%) PMO
7 13 (1.10%) ISO/IEC 27001
7 13 (1.10%) SLA
8 9 (0.76%) NCSC
9 7 (0.59%) NIST
10 6 (0.51%) PCI DSS
11 5 (0.42%) GAAP
11 5 (0.42%) GDPR
12 4 (0.34%) ISO 20022
12 4 (0.34%) ISO/IEC 20000
12 4 (0.34%) MiFID
12 4 (0.34%) UCITS
13 3 (0.25%) SOC 2
14 2 (0.17%) GRC
14 2 (0.17%) IFRS 17
System Software
1 122 (10.31%) Docker
2 31 (2.62%) Active Directory
3 8 (0.68%) XenDesktop
4 4 (0.34%) Virtual Machines
4 4 (0.34%) XenApp
5 1 (0.085%) IAG
5 1 (0.085%) Microsoft Virtual Server
5 1 (0.085%) Virtual Servers
5 1 (0.085%) VMware ESXi
5 1 (0.085%) VMware Infrastructure
5 1 (0.085%) vSphere
Systems Management
1 122 (10.31%) Kubernetes
2 76 (6.42%) Grafana
3 52 (4.40%) Terraform
4 14 (1.18%) Jamf Pro
5 11 (0.93%) Microsoft Intune
6 8 (0.68%) Prometheus
7 7 (0.59%) Ansible
8 4 (0.34%) Cisco UCCE
8 4 (0.34%) Cisco UCCX
9 3 (0.25%) CSIRT
9 3 (0.25%) SCCM
9 3 (0.25%) Single Sign-On
10 2 (0.17%) Argo
10 2 (0.17%) SCOM
10 2 (0.17%) SCOrch
11 1 (0.085%) Kibana
11 1 (0.085%) logstash
Vendors
1 158 (13.36%) Microsoft
2 70 (5.92%) Google
3 42 (3.55%) Adobe
4 30 (2.54%) Apple
5 29 (2.45%) Salesforce
6 28 (2.37%) Databricks
7 22 (1.86%) Bloomberg
8 20 (1.69%) Oracle
9 17 (1.44%) ServiceNow
10 16 (1.35%) Cisco
11 13 (1.10%) Dynatrace
11 13 (1.10%) SAP
12 12 (1.01%) Citrix
13 11 (0.93%) CyberArk
14 10 (0.85%) Sage
14 10 (0.85%) Tanium
15 9 (0.76%) Splunk
15 9 (0.76%) VMware
16 8 (0.68%) Informatica
16 8 (0.68%) Red Hat