Azure Contracts in Birmingham

Microsoft Azure
West Midlands > Birmingham

The table below provides summary statistics for contract job vacancies advertised in Birmingham requiring Azure skills. It includes a benchmarking guide to the contractor rates offered in vacancies that cited Azure over the 6 months leading up to 20 June 2024, comparing them to the same period in the previous two years.

6 months to
20 Jun 2024
Same period 2023 Same period 2022
Rank 7 1 3
Rank change year-on-year -6 +2 -1
Contract jobs citing Azure 89 162 245
As % of all contract jobs advertised in Birmingham 11.62% 18.22% 18.77%
As % of the Cloud Services category 41.01% 50.00% 52.69%
Number of daily rates quoted 67 121 195
10th Percentile £280 £363 £363
25th Percentile £363 £413 £413
Median daily rate (50th Percentile) £500 £520 £525
Median % change year-on-year -3.85% -0.95% +16.67%
75th Percentile £638 £638 £606
90th Percentile £653 £700 £700
West Midlands median daily rate £550 £520 £520
% change year-on-year +5.77% - +15.56%
Number of hourly rates quoted 1 0 0
Median hourly rate £19.95 - -
West Midlands median hourly rate £19.95 - -

All Cloud Skills
Birmingham

Azure falls under the Cloud Services category. For comparison with the information above, the following table provides summary statistics for all contract job vacancies requiring cloud computing skills in Birmingham.

Contract vacancies with a requirement for cloud computing skills 217 324 465
As % of all contract IT jobs advertised in Birmingham 28.33% 36.45% 35.63%
Number of daily rates quoted 169 234 349
10th Percentile £227 £311 £299
25th Percentile £350 £400 £410
Median daily rate (50th Percentile) £475 £480 £500
Median % change year-on-year -1.04% -4.00% +11.11%
75th Percentile £625 £621 £600
90th Percentile £680 £700 £688
West Midlands median daily rate £451 £500 £495
% change year-on-year -9.90% +1.01% +10.00%
Number of hourly rates quoted 9 4 3
10th Percentile £14.08 £15.54 £11.10
25th Percentile £16.00 £15.98 £11.69
Median hourly rate £22.50 £20.24 £12.66
Median % change year-on-year +11.17% +59.87% -14.89%
75th Percentile £26.50 £24.47 £13.83
90th Percentile £32.20 £25.31 £14.53
West Midlands median hourly rate £22.50 £20.24 £19.00
% change year-on-year +11.17% +6.53% +31.03%

Azure
Job Vacancy Trend in Birmingham

Job postings citing Azure as a proportion of all IT jobs advertised in Birmingham.
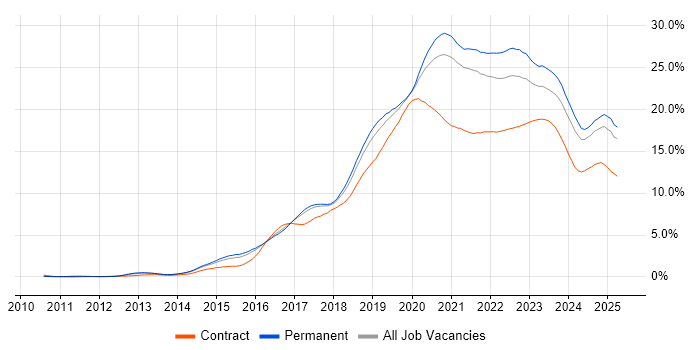
Job vacancy trend for Azure in Birmingham

Azure
Contractor Daily Rate Trend in Birmingham

3-month moving average daily rate quoted in jobs citing Azure in Birmingham.

Daily rate trend for Azure in Birmingham

Azure
Daily Rate Histogram in Birmingham

Daily rate distribution for jobs citing Azure in Birmingham over the 6 months to 20 June 2024.

Daily rate histogram for Azure in Birmingham

Azure
Contractor Hourly Rate Trend in Birmingham

3-month moving average hourly rates quoted in jobs citing Azure in Birmingham.

Hourly rate trend for Azure in Birmingham

Azure
Co-occurring Skills and Capabilities in Birmingham by Category

The follow tables expand on the table above by listing co-occurrences grouped by category. The same employment type, locality and period is covered with up to 20 co-occurrences shown in each of the following categories:

Application Platforms
1 16 (17.98%) SharePoint
2 13 (14.61%) Microsoft Exchange
3 2 (2.25%) IIS
3 2 (2.25%) WordPress
Applications
1 3 (3.37%) Microsoft Office
2 2 (2.25%) MS Visio
3 1 (1.12%) Microsoft Excel
Business Applications
1 5 (5.62%) Dynamics CRM
2 2 (2.25%) NetSuite
Cloud Services
1 26 (29.21%) Microsoft 365
2 20 (22.47%) Power Platform
3 11 (12.36%) Azure DevOps
4 10 (11.24%) PowerApps
5 9 (10.11%) AWS
5 9 (10.11%) Entra ID
5 9 (10.11%) Power Automate
5 9 (10.11%) Serverless
6 8 (8.99%) Azure Data Factory
6 8 (8.99%) Azure Functions
6 8 (8.99%) OneDrive
7 7 (7.87%) PaaS
8 6 (6.74%) Azure Monitor
8 6 (6.74%) GCP
9 4 (4.49%) Azure Synapse Analytics
9 4 (4.49%) Dynamics 365
10 3 (3.37%) Azure Cosmos DB
10 3 (3.37%) GitHub
10 3 (3.37%) SaaS
11 2 (2.25%) IaaS
Communications & Networking
1 8 (8.99%) Firewall
2 7 (7.87%) LAN
2 7 (7.87%) WAN
3 6 (6.74%) Unified Communications
3 6 (6.74%) VPN
4 4 (4.49%) DNS
5 3 (3.37%) SAN
5 3 (3.37%) VLAN
5 3 (3.37%) VoIP
5 3 (3.37%) Wi-Fi
6 2 (2.25%) DHCP
6 2 (2.25%) Fibre Channel
6 2 (2.25%) iSCSI
6 2 (2.25%) NAS
6 2 (2.25%) Wireless
7 1 (1.12%) IPsec
7 1 (1.12%) Kerberos
7 1 (1.12%) SSL
Database & Business Intelligence
1 20 (22.47%) Power BI
2 16 (17.98%) SQL Server
3 5 (5.62%) Data Warehouse
3 5 (5.62%) SQL Server Integration Services
4 2 (2.25%) Azure SQL Database
4 2 (2.25%) Data Lake
4 2 (2.25%) PostgreSQL
4 2 (2.25%) Relational Database
4 2 (2.25%) SQL Server Reporting Services
4 2 (2.25%) Tableau
5 1 (1.12%) Azure SQL Data Warehouse
5 1 (1.12%) Big Data
5 1 (1.12%) DB2
5 1 (1.12%) Flink
5 1 (1.12%) Microsoft Analysis Services
5 1 (1.12%) MySQL
5 1 (1.12%) NoSQL
5 1 (1.12%) OLAP
5 1 (1.12%) OLTP
5 1 (1.12%) Redis
Development Applications
1 2 (2.25%) Hudson
1 2 (2.25%) Octopus Deploy
1 2 (2.25%) Selenium
2 1 (1.12%) Artifactory
2 1 (1.12%) Git
2 1 (1.12%) TeamCity
2 1 (1.12%) Visual Studio Team System
General
1 22 (24.72%) Social Skills
2 9 (10.11%) Finance
3 4 (4.49%) Analytical Skills
3 4 (4.49%) Inclusion and Diversity
3 4 (4.49%) Public Sector
4 3 (3.37%) Documentation Skills
4 3 (3.37%) German Language
5 2 (2.25%) Influencing Skills
5 2 (2.25%) Presentation Skills
6 1 (1.12%) Banking
6 1 (1.12%) Fire and Rescue
6 1 (1.12%) Legal
6 1 (1.12%) Police
6 1 (1.12%) Retail
6 1 (1.12%) Telecoms
Job Titles
1 15 (16.85%) Analyst
2 12 (13.48%) Architect
3 10 (11.24%) Administrator
4 9 (10.11%) Microsoft 365 Engineer
5 8 (8.99%) SharePoint Administrator
6 7 (7.87%) Azure Administrator
6 7 (7.87%) Business Analyst
6 7 (7.87%) Developer
6 7 (7.87%) Microsoft Engineer
6 7 (7.87%) Senior
7 6 (6.74%) Azure Architect
7 6 (6.74%) Azure Engineer
7 6 (6.74%) Microsoft 365 Administrator
7 6 (6.74%) Test Analyst
8 5 (5.62%) Infrastructure Engineer
9 4 (4.49%) Consultant
10 3 (3.37%) Senior Developer
10 3 (3.37%) Solutions Architect
10 3 (3.37%) Support Engineer
10 3 (3.37%) Test Manager
Libraries, Frameworks & Software Standards
1 4 (4.49%) .NET
2 3 (3.37%) Middleware
3 2 (2.25%) .NET Core
3 2 (2.25%) JSON
3 2 (2.25%) Kafka
3 2 (2.25%) LAMP
3 2 (2.25%) Microsoft Graph
3 2 (2.25%) OAuth
3 2 (2.25%) SOAP
4 1 (1.12%) ADO
4 1 (1.12%) Blazor
4 1 (1.12%) CSS
4 1 (1.12%) HTML
4 1 (1.12%) RabbitMQ
4 1 (1.12%) REST
4 1 (1.12%) RESTful
4 1 (1.12%) Vue
4 1 (1.12%) Web Services
4 1 (1.12%) XML
Miscellaneous
1 6 (6.74%) Digital Signage
1 6 (6.74%) PKI
1 6 (6.74%) Public Cloud
2 4 (4.49%) Clustering
2 4 (4.49%) Replication
3 3 (3.37%) Driving Licence
4 2 (2.25%) Data Protection Act
4 2 (2.25%) Linux Command Line
4 2 (2.25%) NHS
5 1 (1.12%) Cloud Native
5 1 (1.12%) Cyber Kill Chain
5 1 (1.12%) Data Centre
5 1 (1.12%) Distributed Denial-of-Service
5 1 (1.12%) Enterprise Software
5 1 (1.12%) Legacy Systems
5 1 (1.12%) Onboarding
5 1 (1.12%) Video Conferencing
Operating Systems
1 27 (30.34%) Windows
2 14 (15.73%) Windows Server
3 11 (12.36%) Windows Server 2019
4 8 (8.99%) Windows Server 2016
5 7 (7.87%) Linux
6 4 (4.49%) Windows 10
6 4 (4.49%) Windows Server 2012
7 3 (3.37%) Mac OS
8 2 (2.25%) Ubuntu
8 2 (2.25%) VMS
9 1 (1.12%) Mac OS X
9 1 (1.12%) zOS
Processes & Methodologies
1 24 (26.97%) DevOps
2 16 (17.98%) Business Intelligence
3 15 (16.85%) Agile
4 12 (13.48%) ITIL
5 9 (10.11%) Analytics
5 9 (10.11%) CRM
5 9 (10.11%) Data Science
5 9 (10.11%) Migration
6 8 (8.99%) Proactive Management
6 8 (8.99%) Web SSO
7 7 (7.87%) Infrastructure Engineering
7 7 (7.87%) Runbook
7 7 (7.87%) Scrum
7 7 (7.87%) Waterfall
8 6 (6.74%) Artificial Intelligence
8 6 (6.74%) Identity Management
8 6 (6.74%) Incident Management
8 6 (6.74%) Problem-Solving
8 6 (6.74%) Service Delivery
8 6 (6.74%) User Acceptance Testing
Programming Languages
1 25 (28.09%) PowerShell
2 18 (20.22%) SQL
3 5 (5.62%) C#
3 5 (5.62%) Python
4 1 (1.12%) Bicep
4 1 (1.12%) JavaScript
4 1 (1.12%) T-SQL
Qualifications
1 10 (11.24%) Degree
2 5 (5.62%) Computer Science Degree
3 3 (3.37%) Azure Certification
3 3 (3.37%) SC Cleared
3 3 (3.37%) Security Cleared
4 2 (2.25%) ISTQB
4 2 (2.25%) PMI Certification
4 2 (2.25%) PMP
5 1 (1.12%) ISEB
5 1 (1.12%) PRINCE2 Certification
Quality Assurance & Compliance
1 5 (5.62%) QA
2 2 (2.25%) Data Quality
2 2 (2.25%) SLA
3 1 (1.12%) ISO/IEC 27001
3 1 (1.12%) ISO/IEC 27002 (supersedes ISO/IEC 17799)
3 1 (1.12%) NIST
System Software
1 17 (19.10%) Active Directory
2 6 (6.74%) Virtual Desktop
3 4 (4.49%) Hyper-V
3 4 (4.49%) VMware Infrastructure
4 3 (3.37%) Virtual Machines
5 2 (2.25%) Docker
5 2 (2.25%) vSphere
6 1 (1.12%) Virtual Servers
6 1 (1.12%) XenApp
6 1 (1.12%) XenDesktop
Systems Management
1 16 (17.98%) Microsoft Intune
1 16 (17.98%) Single Sign-On
2 11 (12.36%) SCCM
3 5 (5.62%) SysTrack
3 5 (5.62%) Terraform
4 3 (3.37%) Autotask
4 3 (3.37%) Failover Clustering
4 3 (3.37%) Jamf Pro
5 2 (2.25%) Active Directory Federation Services
6 1 (1.12%) Ansible
6 1 (1.12%) Kubernetes
6 1 (1.12%) Progress Chef
6 1 (1.12%) Proxmox
6 1 (1.12%) Puppet
6 1 (1.12%) Rancher
Vendors
1 36 (40.45%) Microsoft
2 10 (11.24%) VMware
3 8 (8.99%) Oracle
4 6 (6.74%) Citrix
4 6 (6.74%) Databricks
5 5 (5.62%) New Relic
5 5 (5.62%) OpenAI
6 3 (3.37%) Apple
6 3 (3.37%) Datto
7 2 (2.25%) Aruba
7 2 (2.25%) Palo Alto
7 2 (2.25%) ProCurve
7 2 (2.25%) SAP
7 2 (2.25%) Synology
7 2 (2.25%) Veeam
7 2 (2.25%) Zerto
8 1 (1.12%) Jitterbit
8 1 (1.12%) MuleSoft
8 1 (1.12%) SnapLogic
8 1 (1.12%) Workday