JIRA Contracts in the Midlands

Atlassian JIRA
England > Midlands

The table below provides summary statistics for contract job vacancies advertised in the Midlands requiring JIRA skills. It includes a benchmarking guide to the contractor rates offered in vacancies that cited JIRA over the 6 months leading up to 14 June 2025, comparing them to the same period in the previous two years.

6 months to
14 Jun 2025
Same period 2024 Same period 2023
Rank 27 67 35
Rank change year-on-year +40 -32 -11
Contract jobs citing JIRA 131 75 175
As % of all contract jobs advertised in the Midlands 6.02% 2.53% 5.42%
As % of the Development Applications category 41.32% 24.59% 45.93%
Number of daily rates quoted 87 53 131
10th Percentile £313 £265 £275
25th Percentile £405 £356 £328
Median daily rate (50th Percentile) £475 £450 £450
Median % change year-on-year +5.56% - -6.25%
75th Percentile £515 £550 £540
90th Percentile £575 £599 £598
England median daily rate £500 £525 £533
% change year-on-year -4.76% -1.41% +1.43%
Number of hourly rates quoted 0 3 0
Median hourly rate - £10.50 -
England median hourly rate £55.00 £62.50 £62.50
% change year-on-year -12.00% - +40.45%

All Development Application Skills
Midlands

JIRA falls under the Development Applications category. For comparison with the information above, the following table provides summary statistics for all contract job vacancies requiring development application skills in the Midlands.

Contract vacancies with a requirement for development application skills 317 305 381
As % of all contract IT jobs advertised in the Midlands 14.57% 10.29% 11.81%
Number of daily rates quoted 227 224 295
10th Percentile £281 £264 £300
25th Percentile £372 £358 £363
Median daily rate (50th Percentile) £463 £449 £480
Median % change year-on-year +3.01% -6.46% +1.05%
75th Percentile £515 £536 £575
90th Percentile £575 £579 £700
England median daily rate £500 £525 £550
% change year-on-year -4.76% -4.55% -
Number of hourly rates quoted 1 12 2
10th Percentile - £10.50 £32.20
25th Percentile - £43.88 £32.96
Median hourly rate £18.20 £56.88 £35.94
Median % change year-on-year -68.00% +58.24% -24.33%
75th Percentile - £58.75 £38.96
90th Percentile - - £39.73
England median hourly rate £59.50 £65.00 £61.50
% change year-on-year -8.46% +5.69% +23.00%

JIRA
Job Vacancy Trend in the Midlands

Job postings citing JIRA as a proportion of all IT jobs advertised in the Midlands.
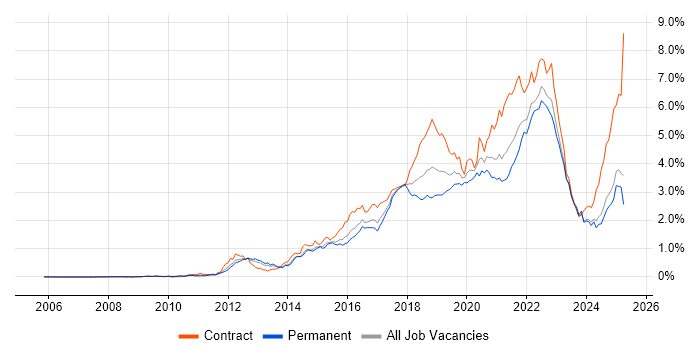
Job vacancy trend for JIRA in the Midlands

JIRA
Contractor Daily Rate Trend in the Midlands

3-month moving average daily rate quoted in jobs citing JIRA in the Midlands.

Daily rate trend for JIRA in the Midlands

JIRA
Daily Rate Histogram in the Midlands

Daily rate distribution for jobs citing JIRA in the Midlands over the 6 months to 14 June 2025.

Daily rate histogram for JIRA in the Midlands

JIRA
Contractor Hourly Rate Trend in the Midlands

3-month moving average hourly rates quoted in jobs citing JIRA in the Midlands.

Hourly rate trend for JIRA in the Midlands

JIRA
Contract Job Locations in the Midlands

The table below looks at the demand and provides a guide to the median contractor rates quoted in IT jobs citing JIRA within the Midlands region over the 6 months to 14 June 2025. The 'Rank Change' column provides an indication of the change in demand within each location based on the same 6 month period last year.

Location Rank Change
on Same Period
Last Year
Matching
Contract
IT Job Ads
Median
Daily Rate
Past 6 Months
Median Daily Rate
% Change
on Same Period
Last Year
Live
Jobs
West Midlands +55 107 £475 -7.09% 118
East Midlands -9 23 £450 +12.50% 44
JIRA
England

JIRA
Co-occurring Skills and Capabilities in the Midlands by Category

The follow tables expand on the table above by listing co-occurrences grouped by category. The same employment type, locality and period is covered with up to 20 co-occurrences shown in each of the following categories:

Application Platforms
1 53 (40.46%) Confluence
2 3 (2.29%) JBoss
3 2 (1.53%) SAS
3 2 (1.53%) SharePoint
4 1 (0.76%) Microsoft Exchange
4 1 (0.76%) nginx
4 1 (0.76%) Tomcat
4 1 (0.76%) WebLogic
Applications
1 8 (6.11%) Microsoft Office
2 4 (3.05%) Microsoft Excel
2 4 (3.05%) MS Visio
3 3 (2.29%) Microsoft Project
4 2 (1.53%) Trello
5 1 (0.76%) Microsoft PowerPoint
5 1 (0.76%) Mozilla Thunderbird
5 1 (0.76%) Open Workbench
Business Applications
1 2 (1.53%) NetSuite
2 1 (0.76%) Actimize
2 1 (0.76%) Oracle Receivables
2 1 (0.76%) SAP S/4HANA
2 1 (0.76%) Teamcenter
Cloud Services
1 32 (24.43%) AWS
2 9 (6.87%) Azure
3 8 (6.11%) Amazon CloudWatch
3 8 (6.11%) Amazon S3
4 7 (5.34%) Amazon EC2
5 5 (3.82%) AWS CodeBuild
5 5 (3.82%) Virtual Private Cloud
6 4 (3.05%) Amazon ELB
6 4 (3.05%) AWS KMS
6 4 (3.05%) OpenShift
6 4 (3.05%) SaaS
7 3 (2.29%) Amazon Glacier
7 3 (2.29%) GitHub
7 3 (2.29%) IaaS
7 3 (2.29%) PaaS
7 3 (2.29%) Power Platform
8 2 (1.53%) AWS Lambda
8 2 (1.53%) Azure DevOps
8 2 (1.53%) Figma
8 2 (1.53%) Serverless
Communications & Networking
1 10 (7.63%) Firewall
2 6 (4.58%) DNS
3 5 (3.82%) Cisco ISE
3 5 (3.82%) HTTP
4 4 (3.05%) BIG-IP
4 4 (3.05%) Cisco ASA
4 4 (3.05%) SMTP
5 3 (2.29%) FTP
5 3 (2.29%) Network Security
5 3 (2.29%) OpenLDAP
5 3 (2.29%) SSH
6 2 (1.53%) DHCP
6 2 (1.53%) SAN
6 2 (1.53%) SSL
6 2 (1.53%) VLAN
7 1 (0.76%) Converged Networks
7 1 (0.76%) IMAP
7 1 (0.76%) Modbus
7 1 (0.76%) Remote Desktop
7 1 (0.76%) Software-Defined Networking
Database & Business Intelligence
1 8 (6.11%) Relational Database
2 7 (5.34%) Data Warehouse
2 7 (5.34%) PostgreSQL
3 6 (4.58%) Amazon RDS
3 6 (4.58%) Big Data
3 6 (4.58%) MySQL
4 5 (3.82%) Elasticsearch
5 4 (3.05%) NoSQL
6 3 (2.29%) SQL Server
7 2 (1.53%) Power BI
8 1 (0.76%) Amazon Aurora
8 1 (0.76%) Data Mart
8 1 (0.76%) IDMS
8 1 (0.76%) Looker
8 1 (0.76%) RDBMS
8 1 (0.76%) SAS Data Integration Studio
8 1 (0.76%) SQL Server Integration Services
8 1 (0.76%) SQL Server Reporting Services
Development Applications
1 20 (15.27%) Git
2 14 (10.69%) Jenkins
3 12 (9.16%) GitLab
4 10 (7.63%) Bitbucket
5 9 (6.87%) Selenium
6 8 (6.11%) Maven
6 8 (6.11%) Sonatype Nexus
7 6 (4.58%) JUnit
7 6 (4.58%) SonarQube
8 5 (3.82%) Atlassian Bamboo
9 4 (3.05%) CA Release Automation
9 4 (3.05%) Cucumber
9 4 (3.05%) Postman
9 4 (3.05%) Vagrant
10 3 (2.29%) Gradle
10 3 (2.29%) Mockito
10 3 (2.29%) REST Assured
10 3 (2.29%) ScriptRunner
10 3 (2.29%) TestNG
10 3 (2.29%) Travis CI
General
1 39 (29.77%) Social Skills
2 19 (14.50%) Finance
3 8 (6.11%) Analytical Skills
4 6 (4.58%) Documentation Skills
4 6 (4.58%) Public Sector
5 5 (3.82%) Automotive
6 2 (1.53%) Banking
6 2 (1.53%) Marketing
7 1 (0.76%) Health Technology
7 1 (0.76%) Humanities
7 1 (0.76%) Inclusion and Diversity
7 1 (0.76%) Influencing Skills
7 1 (0.76%) Local Government
7 1 (0.76%) Manufacturing
7 1 (0.76%) Organisational Skills
7 1 (0.76%) Presentation Skills
7 1 (0.76%) Retail
Job Titles
1 18 (13.74%) Analyst
2 16 (12.21%) Developer
2 16 (12.21%) Tester
3 10 (7.63%) Engagement Manager
3 10 (7.63%) Senior
4 9 (6.87%) OAT Analyst
5 8 (6.11%) Infrastructure Engineer
5 8 (6.11%) Lead
6 7 (5.34%) DevOps Engineer
6 7 (5.34%) Full-Stack Developer
7 6 (4.58%) Project Manager
7 6 (4.58%) Senior Developer
8 5 (3.82%) Business Analyst
8 5 (3.82%) Java Developer
8 5 (3.82%) Technical Manager
9 4 (3.05%) Consultant
9 4 (3.05%) Data Manager
9 4 (3.05%) Delivery Manager
9 4 (3.05%) Network Engineer
9 4 (3.05%) Network Infrastructure Engineer
Libraries, Frameworks & Software Standards
1 9 (6.87%) React
2 8 (6.11%) Spring Boot
3 7 (5.34%) Node.js
3 7 (5.34%) REST
4 6 (4.58%) .NET
4 6 (4.58%) HTML
5 5 (3.82%) CSS
5 5 (3.82%) Hibernate
5 5 (3.82%) Middleware
6 4 (3.05%) Spring
6 4 (3.05%) YAML
7 3 (2.29%) .NET Core
7 3 (2.29%) Elastic Stack
7 3 (2.29%) Jest
7 3 (2.29%) JPA
7 3 (2.29%) Kafka
7 3 (2.29%) LDAP
7 3 (2.29%) Redux
7 3 (2.29%) RESTful
8 2 (1.53%) AngularJS
Miscellaneous
1 22 (16.79%) SCADA
2 12 (9.16%) Product Ownership
3 8 (6.11%) Data Centre
4 7 (5.34%) Legacy Systems
5 3 (2.29%) Data Structures
5 3 (2.29%) Replication
6 2 (1.53%) Mainframe
6 2 (1.53%) Management Information System
6 2 (1.53%) Mobile App
7 1 (0.76%) Analytical Mindset
7 1 (0.76%) Enterprise Software
7 1 (0.76%) Foreign Exchange (FX)
7 1 (0.76%) Manufacturing Execution System
7 1 (0.76%) PMI
7 1 (0.76%) Public Cloud
7 1 (0.76%) Self-Motivation
7 1 (0.76%) Virtual Team
Operating Systems
1 16 (12.21%) Linux
2 11 (8.40%) Windows
3 8 (6.11%) Unix
4 4 (3.05%) Amazon Linux
4 4 (3.05%) VMS
5 2 (1.53%) CentOS
5 2 (1.53%) Debian
5 2 (1.53%) Red Hat Enterprise Linux
5 2 (1.53%) Ubuntu
6 1 (0.76%) Mac OS
6 1 (0.76%) Windows Server
Processes & Methodologies
1 72 (54.96%) Agile
2 24 (18.32%) CI/CD
2 24 (18.32%) DevOps
3 21 (16.03%) Project Management
3 21 (16.03%) Scrum
4 20 (15.27%) Test Strategy
5 17 (12.98%) Problem-Solving
6 16 (12.21%) Microservices
6 16 (12.21%) Migration
6 16 (12.21%) Project Delivery
6 16 (12.21%) Stakeholder Management
7 13 (9.92%) Scenario Testing
7 13 (9.92%) Test Management
8 12 (9.16%) Agile Project Management
8 12 (9.16%) Performance Testing
8 12 (9.16%) Systems Engineering
8 12 (9.16%) Workflow
9 11 (8.40%) Change Management
9 11 (8.40%) Functional Testing
9 11 (8.40%) Test Automation
Programming Languages
1 22 (16.79%) SQL
2 16 (12.21%) Python
3 15 (11.45%) JavaScript
4 13 (9.92%) Java
5 10 (7.63%) PowerShell
6 8 (6.11%) Shell Script
6 8 (6.11%) TypeScript
7 7 (5.34%) Groovy
8 5 (3.82%) Bash
8 5 (3.82%) C#
8 5 (3.82%) Perl
8 5 (3.82%) PL/SQL
9 2 (1.53%) Go
9 2 (1.53%) R
10 1 (0.76%) Apex Code
10 1 (0.76%) Bicep
10 1 (0.76%) COBOL
10 1 (0.76%) PHP
Qualifications
1 31 (23.66%) Security Cleared
2 29 (22.14%) SC Cleared
3 10 (7.63%) Degree
4 5 (3.82%) BPSS Clearance
4 5 (3.82%) ISTQB
5 4 (3.05%) CISSP
5 4 (3.05%) Computer Science Degree
6 3 (2.29%) CEH
6 3 (2.29%) DV Cleared
6 3 (2.29%) PMI Certification
6 3 (2.29%) PMP
7 2 (1.53%) CBAP
7 2 (1.53%) ISEB
8 1 (0.76%) A+ Certification
8 1 (0.76%) AWS Certification
8 1 (0.76%) IIBA
8 1 (0.76%) ISTQB Advanced Certification
8 1 (0.76%) ISTQB Foundation Certification
8 1 (0.76%) Microsoft Certification
8 1 (0.76%) SAS Certification
Quality Assurance & Compliance
1 8 (6.11%) QA
2 2 (1.53%) SLA
3 1 (0.76%) Accessibility
3 1 (0.76%) Actionable Recommendations
3 1 (0.76%) Automotive SPICE
3 1 (0.76%) Data Quality
3 1 (0.76%) ISO 26262
3 1 (0.76%) PMO
System Software
1 17 (12.98%) Docker
2 5 (3.82%) Active Directory
3 3 (2.29%) DFS Replication
4 1 (0.76%) Dovecot
4 1 (0.76%) Embedded Firmware
4 1 (0.76%) Firmware
4 1 (0.76%) Postfix
4 1 (0.76%) Squid
4 1 (0.76%) Virtual Desktop
Systems Management
1 12 (9.16%) Kubernetes
2 8 (6.11%) Terraform
3 6 (4.58%) HP ALM
3 6 (4.58%) Prometheus
4 5 (3.82%) Ansible
4 5 (3.82%) Grafana
4 5 (3.82%) Kibana
5 4 (3.05%) Progress Chef
5 4 (3.05%) Puppet
6 3 (2.29%) Nessus
7 1 (0.76%) Argo
7 1 (0.76%) FortiGate
7 1 (0.76%) logstash
7 1 (0.76%) QRadar
7 1 (0.76%) Trend Micro Deep Security
Vendors
1 24 (18.32%) Atlassian
2 16 (12.21%) Oracle
3 12 (9.16%) Microsoft
4 11 (8.40%) ServiceNow
5 6 (4.58%) HP
6 5 (3.82%) Cisco
6 5 (3.82%) MuleSoft
6 5 (3.82%) Salesforce
7 4 (3.05%) CheckPoint
7 4 (3.05%) F5
7 4 (3.05%) IBM
7 4 (3.05%) Palo Alto
7 4 (3.05%) Red Hat
7 4 (3.05%) SAP
7 4 (3.05%) SolarWinds
8 3 (2.29%) Veracode
9 2 (1.53%) AppDynamics
9 2 (1.53%) CA Agile Central
9 2 (1.53%) Sophos
9 2 (1.53%) Splunk