Task Automation Contract Job Trends in Reading

Task Automation
Berkshire > Reading

The table below provides summary statistics and contractor rates for jobs advertised in Reading requiring Task Automation skills. It covers contract job vacancies from the 6 months leading up to 31 October 2025, with comparisons to the same periods in the previous two years.

6 months to
31 Oct 2025
Same period 2024 Same period 2023
Rank 61 89 86
Rank change year-on-year +28 -3 +4
Contract jobs citing Task Automation 13 5 1
As % of all contract jobs in Reading 2.01% 0.46% 0.092%
As % of the Processes & Methodologies category 2.23% 0.53% 0.10%
Number of daily rates quoted 6 3 1
10th Percentile £414 £376 -
25th Percentile £444 £378 -
Median daily rate (50th Percentile) £500 £380 £550
Median % change year-on-year +31.58% -30.91% -14.40%
75th Percentile £578 £390 -
90th Percentile £593 £396 -
Berkshire median daily rate £493 £466 £500
% change year-on-year +5.69% -6.80% -21.26%

All Process and Methodology Skills
Reading

Task Automation falls under the Processes and Methodologies category. For comparison with the information above, the following table provides summary statistics for all contract job vacancies requiring process or methodology skills in Reading.

Contract vacancies with a requirement for process or methodology skills 583 952 982
As % of all contract IT jobs advertised in Reading 89.97% 88.31% 90.01%
Number of daily rates quoted 390 522 658
10th Percentile £349 £350 £250
25th Percentile £450 £463 £407
Median daily rate (50th Percentile) £525 £575 £525
Median % change year-on-year -8.70% +9.52% +1.94%
75th Percentile £600 £650 £625
90th Percentile £650 £700 £700
Berkshire median daily rate £500 £540 £520
% change year-on-year -7.41% +3.85% +4.00%
Number of hourly rates quoted 31 21 14
10th Percentile - £14.50 £29.04
25th Percentile £14.75 £26.25 £59.32
Median hourly rate £37.28 £60.46 £63.40
Median % change year-on-year -38.33% -4.64% +15.26%
75th Percentile £61.50 £63.41 £67.42
90th Percentile £72.00 £74.87 £75.18
Berkshire median hourly rate £29.31 £58.49 £61.25
% change year-on-year -49.90% -4.51% +21.29%

Task Automation
Job Vacancy Trend in Reading

Historical trend showing the proportion of contract IT job postings citing Task Automation relative to all contract IT jobs advertised in Reading.
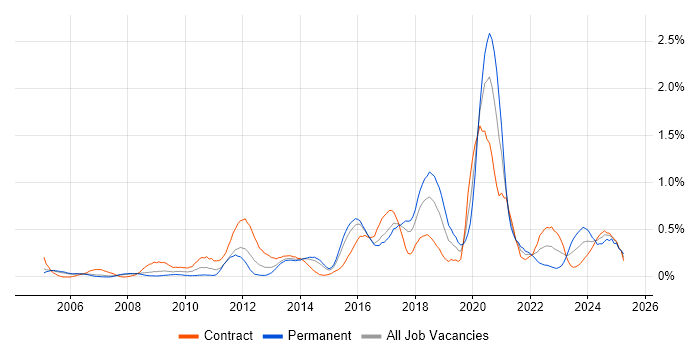
Task Automation job vacancy trend in Reading

Task Automation
Daily Rate Trend in Reading

Contractor daily rate distribution trend for jobs in Reading citing Task Automation.

Contractor daily rate distribution trend for jobs in Reading citing Task Automation

Task Automation
Daily Rate Histogram in Reading

Daily rate distribution for jobs citing Task Automation in Reading over the 6 months to 31 October 2025.

Daily rate histogram for Task Automation in Reading

Task Automation
Co-Occurring Skills & Capabilities in Reading by Category

The following tables expand on the one above by listing co-occurrences grouped by category. They cover the same employment type, locality and period, with up to 20 co-occurrences shown in each category:

Application Platforms
1 3 (23.08%) Oracle SOA Suite
1 3 (23.08%) Oracle Workflow
1 3 (23.08%) WebLogic
2 2 (15.38%) Microsoft Exchange
3 1 (7.69%) SharePoint
Business Applications
1 3 (23.08%) Oracle EBS
1 3 (23.08%) Oracle EBS R12
1 3 (23.08%) Oracle ERP
Cloud Services
1 4 (30.77%) Azure
2 3 (23.08%) OCI
3 2 (15.38%) AWS
3 2 (15.38%) Entra ID
3 2 (15.38%) Microsoft 365
4 1 (7.69%) GCP
4 1 (7.69%) OneDrive
4 1 (7.69%) Power Automate
4 1 (7.69%) Power Platform
4 1 (7.69%) PowerApps
Communications & Networking
1 2 (15.38%) Network Security
2 1 (7.69%) DHCP
2 1 (7.69%) DNS
Database & Business Intelligence
1 3 (23.08%) Oracle BI EE
2 2 (15.38%) Oracle Database
3 1 (7.69%) Amazon RDS
3 1 (7.69%) Apache Cassandra
3 1 (7.69%) Azure SQL Database
3 1 (7.69%) Data Warehouse
3 1 (7.69%) MongoDB
3 1 (7.69%) MySQL
3 1 (7.69%) NoSQL
3 1 (7.69%) PostgreSQL
3 1 (7.69%) Power BI
3 1 (7.69%) RDBMS
3 1 (7.69%) Relational Database
3 1 (7.69%) SQL Server
General
1 6 (46.15%) Legal
2 5 (38.46%) Social Skills
3 4 (30.77%) Public Sector
4 2 (15.38%) Analytical Skills
5 1 (7.69%) Documentation Skills
5 1 (7.69%) Finance
Job Titles
1 6 (46.15%) Analyst
1 6 (46.15%) SOC Analyst
2 3 (23.08%) DBA
2 3 (23.08%) Oracle DBA
3 1 (7.69%) Architect
3 1 (7.69%) Database Specialist
3 1 (7.69%) Exchange Specialist
3 1 (7.69%) Junior
3 1 (7.69%) Microsoft 365 Architect
3 1 (7.69%) Microsoft 365 Engineer
3 1 (7.69%) Senior
3 1 (7.69%) Technical Specialist
Miscellaneous
1 6 (46.15%) Management Information System
2 5 (38.46%) Security Operations Centre
3 4 (30.77%) Cyber Threat
4 2 (15.38%) Security Posture
5 1 (7.69%) Clustering
5 1 (7.69%) Distributed Systems
5 1 (7.69%) Replication
Operating Systems
1 7 (53.85%) Windows
2 6 (46.15%) Linux
3 3 (23.08%) Unix
4 1 (7.69%) Windows Server
Processes & Methodologies
1 6 (46.15%) Behavioural Analysis
1 6 (46.15%) Cyber Threat Intelligence
1 6 (46.15%) Data Privacy
1 6 (46.15%) Forensic Analysis
1 6 (46.15%) Incident Response
1 6 (46.15%) Malware Analysis
1 6 (46.15%) Risk Management
1 6 (46.15%) SIEM
1 6 (46.15%) Threat Intelligence
2 5 (38.46%) Disaster Recovery
2 5 (38.46%) Security Operations
3 4 (30.77%) Database Tuning
3 4 (30.77%) Performance Tuning
3 4 (30.77%) Problem-Solving
4 3 (23.08%) Capacity Planning
4 3 (23.08%) ERP
4 3 (23.08%) Proactive Monitoring
4 3 (23.08%) SOA
4 3 (23.08%) Systems Engineering
4 3 (23.08%) Workflow
Programming Languages
1 9 (69.23%) PowerShell
2 8 (61.54%) Python
3 4 (30.77%) SQL
4 3 (23.08%) Perl
4 3 (23.08%) PL/SQL
5 1 (7.69%) Bash
5 1 (7.69%) Go
5 1 (7.69%) Java
Qualifications
1 7 (53.85%) Security Cleared
2 6 (46.15%) CFCE
2 6 (46.15%) CISSP
2 6 (46.15%) GCFA
2 6 (46.15%) GCIA
2 6 (46.15%) GCIH
2 6 (46.15%) GIAC
3 3 (23.08%) SC Cleared
4 2 (15.38%) Azure Certification
4 2 (15.38%) Computer Science Degree
4 2 (15.38%) Degree
5 1 (7.69%) AWS Certification
5 1 (7.69%) Microsoft Certification
5 1 (7.69%) OCP
5 1 (7.69%) Oracle Certification
Quality Assurance & Compliance
1 7 (53.85%) GDPR
1 7 (53.85%) ISO/IEC 27001
2 6 (46.15%) HIPAA
2 6 (46.15%) NIST
3 1 (7.69%) QA
System Software
1 3 (23.08%) Oracle RAC
2 2 (15.38%) Active Directory
Systems Management
1 5 (38.46%) Computer Emergency Response Teams
2 3 (23.08%) Enterprise Manager Cloud Control
2 3 (23.08%) Oracle Enterprise Manager
2 3 (23.08%) Oracle RMAN
3 1 (7.69%) Kubernetes
3 1 (7.69%) Microsoft Intune
Vendors
1 8 (61.54%) Microsoft
2 6 (46.15%) ArcSight
2 6 (46.15%) LogRhythm
2 6 (46.15%) Splunk
3 4 (30.77%) CrowdStrike
3 4 (30.77%) Oracle