Architect
Berkshire > Reading
The median Architect daily rate in Reading is £650, according to job vacancies posted in the 6 months leading up to 1 May 2025.
The table below provides contractor rate benchmarking and summary statistics, comparing them to the same period in the previous two years.
| 6 months to 1 May 2025 |
Same period 2024 | Same period 2023 | |
|---|---|---|---|
| Rank | 10 | 28 | 18 |
| Rank change year-on-year | +18 | -10 | -4 |
| Contract jobs requiring an Architect | 80 | 70 | 99 |
| As % of all contract jobs advertised in Reading | 13.40% | 5.87% | 9.51% |
| As % of the Job Titles category | 14.21% | 6.29% | 9.94% |
| Number of daily rates quoted | 56 | 25 | 75 |
| 10th Percentile | £513 | £433 | £500 |
| 25th Percentile | £600 | £500 | £550 |
| Median daily rate (50th Percentile) | £650 | £600 | £675 |
| Median % change year-on-year | +8.33% | -11.11% | +9.76% |
| 75th Percentile | £700 | £699 | £725 |
| 90th Percentile | £825 | £721 | £772 |
| Berkshire median daily rate | £625 | £618 | £650 |
| % change year-on-year | +1.21% | -5.00% | +5.69% |
| Number of hourly rates quoted | 0 | 12 | 1 |
| 10th Percentile | - | £82.44 | - |
| 25th Percentile | - | - | £53.50 |
| Median hourly rate | - | £87.46 | £55.00 |
| Median % change year-on-year | - | +59.02% | - |
| 75th Percentile | - | £87.53 | £56.50 |
| 90th Percentile | - | - | - |
| Berkshire median hourly rate | £79.50 | £87.46 | £66.75 |
| % change year-on-year | -9.10% | +31.03% | -16.98% |
All Contract IT Job Vacancies
Reading
For comparison with the information above, the following table provides summary statistics for all contract IT job vacancies in Reading. Most job vacancies include a discernible job title that can be normalized. As such, the figures in the second row provide an indication of the number of contract jobs in our overall sample.
| Contract vacancies in Reading with a recognized job title | 563 | 1,112 | 996 |
| % of contract IT jobs with a recognized job title | 94.30% | 93.29% | 95.68% |
| Number of daily rates quoted | 340 | 632 | 664 |
| 10th Percentile | £325 | £213 | £363 |
| 25th Percentile | £450 | £413 | £453 |
| Median daily rate (50th Percentile) | £550 | £533 | £550 |
| Median % change year-on-year | +3.19% | -3.09% | +10.00% |
| 75th Percentile | £638 | £623 | £651 |
| 90th Percentile | £700 | £688 | £721 |
| Berkshire median daily rate | £504 | £513 | £525 |
| % change year-on-year | -1.76% | -2.38% | +7.09% |
| Number of hourly rates quoted | 4 | 51 | 24 |
| 10th Percentile | - | £35.00 | £26.45 |
| 25th Percentile | - | £52.90 | £51.48 |
| Median hourly rate | £70.00 | £61.60 | £65.00 |
| Median % change year-on-year | +13.64% | -5.23% | +150.00% |
| 75th Percentile | £71.80 | £74.66 | £74.20 |
| 90th Percentile | £75.03 | £87.46 | £79.19 |
| Berkshire median hourly rate | £63.37 | £59.50 | £56.89 |
| % change year-on-year | +6.51% | +4.60% | +170.88% |
Architect
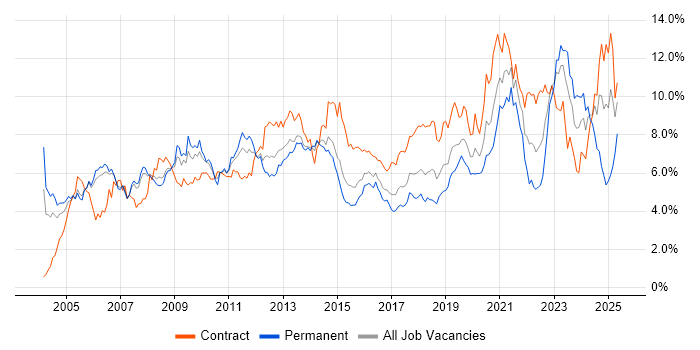
Job Vacancy Trend in Reading
Job postings that featured Architect in the job title as a proportion of all IT jobs advertised in Reading.

Architect
Contractor Daily Rate Trend in Reading
3-month moving average daily rate quoted in jobs citing Architect in Reading.
Architect
Daily Rate Histogram in Reading
Daily rate distribution for jobs citing Architect in Reading over the 6 months to 1 May 2025.
Architect
Contractor Hourly Rate Trend in Reading
3-month moving average hourly rates quoted in jobs citing Architect in Reading.
Architect Skill Set
Top 30 Co-occurring Skills and Capabilities in Reading
For the 6 months to 1 May 2025, Architect contract job roles required the following skills and capabilities in order of popularity. The figures indicate the absolute number co-occurrences and as a proportion of all contract job ads across the Reading region featuring Architect in the job title.
|
|
Architect Skill Set
Co-occurring Skills and Capabilities in Reading by Category
The follow tables expand on the table above by listing co-occurrences grouped by category. The same employment type, locality and period is covered with up to 20 co-occurrences shown in each of the following categories:
|
|
||||||||||||||||||||||||||||||||||||||||||||||||||||||||||||||||||||||||||||||||||||||||||
|
|
||||||||||||||||||||||||||||||||||||||||||||||||||||||||||||||||||||||||||||||||||||||||||
|
|
||||||||||||||||||||||||||||||||||||||||||||||||||||||||||||||||||||||||||||||||||||||||||
|
|
||||||||||||||||||||||||||||||||||||||||||||||||||||||||||||||||||||||||||||||||||||||||||
|
|
||||||||||||||||||||||||||||||||||||||||||||||||||||||||||||||||||||||||||||||||||||||||||
|
|
||||||||||||||||||||||||||||||||||||||||||||||||||||||||||||||||||||||||||||||||||||||||||
|
|
||||||||||||||||||||||||||||||||||||||||||||||||||||||||||||||||||||||||||||||||||||||||||
|
|
||||||||||||||||||||||||||||||||||||||||||||||||||||||||||||||||||||||||||||||||||||||||||
|
|
||||||||||||||||||||||||||||||||||||||||||||||||||||||||||||||||||||||||||||||||||||||||||
