Terraform Contracts in Reading

Terraform
Berkshire > Reading

The table below provides summary statistics for contract job vacancies advertised in Reading requiring Terraform skills. It includes a benchmarking guide to the contractor rates offered in vacancies that cited Terraform over the 6 months leading up to 1 May 2025, comparing them to the same period in the previous two years.

6 months to
1 May 2025
Same period 2024 Same period 2023
Rank 42 60 45
Rank change year-on-year +18 -15 -7
Contract jobs citing Terraform 18 31 42
As % of all contract jobs advertised in Reading 3.02% 2.60% 4.03%
As % of the Systems Management category 28.57% 17.32% 34.71%
Number of daily rates quoted 8 21 33
10th Percentile £444 £513 £486
25th Percentile £594 £525 £553
Median daily rate (50th Percentile) £650 £650 £650
Median % change year-on-year - - +8.11%
75th Percentile £678 £688 £750
90th Percentile £688 £713 -
Berkshire median daily rate £500 £625 £650
% change year-on-year -20.00% -3.85% +8.33%

All Systems Management Skills
Reading

Terraform falls under the Systems Management category. For comparison with the information above, the following table provides summary statistics for all contract job vacancies requiring systems management skills in Reading.

Contract vacancies with a requirement for systems management skills 63 179 121
As % of all contract IT jobs advertised in Reading 10.55% 15.02% 11.62%
Number of daily rates quoted 32 134 89
10th Percentile £409 £205 £425
25th Percentile £450 £213 £504
Median daily rate (50th Percentile) £563 £575 £593
Median % change year-on-year -2.17% -2.95% +8.72%
75th Percentile £663 £608 £700
90th Percentile £686 £650 £763
Berkshire median daily rate £500 £525 £538
% change year-on-year -4.76% -2.33% +2.38%
Number of hourly rates quoted 0 1 3
10th Percentile - - £56.00
25th Percentile - - £61.25
Median hourly rate - £65.00 £70.00
Median % change year-on-year - -7.14% +600.00%
75th Percentile - - £75.69
90th Percentile - - £79.10
Berkshire median hourly rate - £65.00 £68.00
% change year-on-year - -4.41% -6.21%

Terraform
Job Vacancy Trend in Reading

Job postings citing Terraform as a proportion of all IT jobs advertised in Reading.
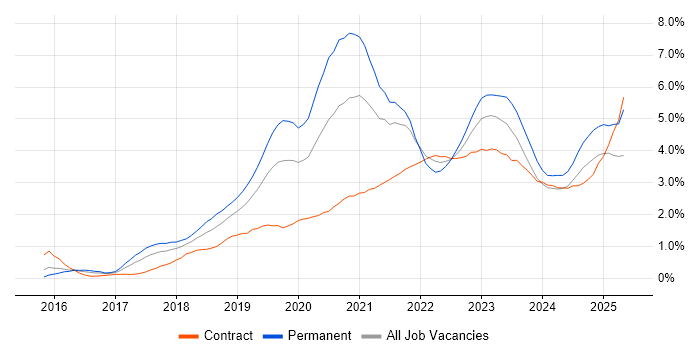
Job vacancy trend for Terraform in Reading

Terraform
Contractor Daily Rate Trend in Reading

3-month moving average daily rate quoted in jobs citing Terraform in Reading.

Daily rate trend for Terraform in Reading

Terraform
Daily Rate Histogram in Reading

Daily rate distribution for jobs citing Terraform in Reading over the 6 months to 1 May 2025.

Daily rate histogram for Terraform in Reading

Terraform
Co-occurring Skills and Capabilities in Reading by Category

The follow tables expand on the table above by listing co-occurrences grouped by category. The same employment type, locality and period is covered with up to 20 co-occurrences shown in each of the following categories:

Cloud Services
1 17 (94.44%) Azure
2 10 (55.56%) AWS
3 6 (33.33%) Azure Monitor
4 5 (27.78%) Azure API Management
4 5 (27.78%) Entra ID
5 3 (16.67%) Azure DevOps
6 2 (11.11%) AWS CloudFormation
7 1 (5.56%) Amazon CloudWatch
7 1 (5.56%) Amazon ECS
7 1 (5.56%) Amazon EKS
7 1 (5.56%) Amazon SQS
7 1 (5.56%) AWS Elastic Beanstalk
7 1 (5.56%) AWS Lambda
7 1 (5.56%) GCP
7 1 (5.56%) GitHub Actions
7 1 (5.56%) PaaS
7 1 (5.56%) SaaS
7 1 (5.56%) Serverless
7 1 (5.56%) SonarCloud
7 1 (5.56%) Virtual Private Cloud
Communications & Networking
1 2 (11.11%) Firewall
2 1 (5.56%) NetScaler
2 1 (5.56%) Network Security
2 1 (5.56%) NGFW
2 1 (5.56%) SSL
Database & Business Intelligence
1 5 (27.78%) Data Warehouse
2 3 (16.67%) SQL Server
2 3 (16.67%) SSDT
3 1 (5.56%) Amazon RDS
3 1 (5.56%) DynamoDB
Development Applications
1 7 (38.89%) Jenkins
2 6 (33.33%) Cucumber
2 6 (33.33%) GitLab
2 6 (33.33%) JIRA
2 6 (33.33%) REST Assured
2 6 (33.33%) Selenium
2 6 (33.33%) SonarQube
3 1 (5.56%) Artifactory
3 1 (5.56%) Atlassian Bamboo
General
1 10 (55.56%) Social Skills
2 9 (50.00%) Analytical Skills
3 5 (27.78%) Law
4 4 (22.22%) Police
Job Titles
1 6 (33.33%) DevOps Engineer
2 5 (27.78%) Java Engineer
2 5 (27.78%) Java Software Engineer
2 5 (27.78%) Software Engineer
3 4 (22.22%) SC Cleared Software Engineer
4 2 (11.11%) Azure DevOps Engineer
4 2 (11.11%) Azure Engineer
4 2 (11.11%) Infrastructure Engineer
4 2 (11.11%) Lead
4 2 (11.11%) Lead DevOps
4 2 (11.11%) Lead DevOps Engineer
5 1 (5.56%) Applications Engineer
5 1 (5.56%) Architect
5 1 (5.56%) Citrix Specialist
5 1 (5.56%) Cloud Specialist
5 1 (5.56%) Consultant
5 1 (5.56%) Developer
5 1 (5.56%) Java Developer
5 1 (5.56%) Migration Engineer
5 1 (5.56%) Security Architect
Libraries, Frameworks & Software Standards
1 7 (38.89%) ARM Templates
2 6 (33.33%) Java EE
2 6 (33.33%) REST
3 5 (27.78%) OAuth
4 3 (16.67%) YAML
5 1 (5.56%) AWS CDK
5 1 (5.56%) Elastic Stack
5 1 (5.56%) SAML
5 1 (5.56%) Serverless Framework
Miscellaneous
1 3 (16.67%) Cloud Native
2 2 (11.11%) Product Ownership
3 1 (5.56%) Distributed Systems
3 1 (5.56%) Operational Technology
3 1 (5.56%) Security Posture
Operating Systems
1 3 (16.67%) Windows
2 2 (11.11%) Linux
3 1 (5.56%) Windows Server
3 1 (5.56%) Windows Server 2019
Processes & Methodologies
1 15 (83.33%) DevOps
2 13 (72.22%) Containerisation
2 13 (72.22%) Infrastructure as Code
3 8 (44.44%) CI/CD
4 7 (38.89%) Configuration Management
4 7 (38.89%) Problem-Solving
4 7 (38.89%) Software Engineering
4 7 (38.89%) Technical Leadership
5 6 (33.33%) Continuous Integration
5 6 (33.33%) Software Architecture
5 6 (33.33%) Test Automation
6 5 (27.78%) B2B
6 5 (27.78%) B2C
6 5 (27.78%) ETL
6 5 (27.78%) Identity Management
6 5 (27.78%) RBAC
6 5 (27.78%) Release Management
7 3 (16.67%) Continuous Improvement
7 3 (16.67%) Infrastructure Automation
7 3 (16.67%) Migration
Programming Languages
1 9 (50.00%) PowerShell
2 6 (33.33%) Java
3 3 (16.67%) Python
4 2 (11.11%) Bash
5 1 (5.56%) Bicep
5 1 (5.56%) Shell Script
Qualifications
1 6 (33.33%) Azure Certification
1 6 (33.33%) SC Cleared
1 6 (33.33%) Security Cleared
2 1 (5.56%) CISM
2 1 (5.56%) CISSP
2 1 (5.56%) TOGAF Certification
System Software
1 8 (44.44%) Docker
2 1 (5.56%) Active Directory
2 1 (5.56%) Virtual Desktop
2 1 (5.56%) VMware Infrastructure
2 1 (5.56%) XenApp
2 1 (5.56%) XenDesktop
Systems Management
1 10 (55.56%) Ansible
2 8 (44.44%) Kubernetes
3 6 (33.33%) Docker Swarm
3 6 (33.33%) Podman
4 3 (16.67%) Single Sign-On
5 2 (11.11%) Progress Chef
5 2 (11.11%) Puppet
6 1 (5.56%) Active Directory Federation Services
Vendors
1 3 (16.67%) Microsoft
1 3 (16.67%) UiPath
2 1 (5.56%) Citrix
2 1 (5.56%) New Relic
2 1 (5.56%) VMware