Analytical Skills Contracts in the Thames Valley

Analytical Skills
South East > Thames Valley

The table below looks at the prevalence of the term Analytical Skills in contract job vacancies in the Thames Valley. Included is a benchmarking guide to the contractor rates offered in vacancies that cited Analytical Skills over the 6 months leading up to 1 May 2025, comparing them to the same period in the previous two years.

6 months to
1 May 2025
Same period 2024 Same period 2023
Rank 8 17 21
Rank change year-on-year +9 +4 +6
Contract jobs citing Analytical Skills 223 242 248
As % of all contract jobs advertised in the Thames Valley 14.76% 9.01% 8.46%
As % of the General category 23.16% 16.30% 13.54%
Number of daily rates quoted 133 133 186
10th Percentile £365 £263 £350
25th Percentile £463 £400 £425
Median daily rate (50th Percentile) £550 £525 £525
Median % change year-on-year +4.76% - +16.02%
75th Percentile £638 £638 £624
90th Percentile £650 £688 £700
South East median daily rate £540 £537 £540
% change year-on-year +0.59% -0.63% +12.26%
Number of hourly rates quoted 10 13 2
10th Percentile - £18.90 £24.66
25th Percentile £14.20 £22.58 £24.90
Median hourly rate £14.85 £24.43 £26.58
Median % change year-on-year -39.21% -8.09% +112.64%
75th Percentile £29.54 £53.75 £29.06
90th Percentile £61.58 £60.20 £29.77
South East median hourly rate £19.21 £18.18 £53.50
% change year-on-year +5.67% -66.03% +42.67%

All General Skills
Thames Valley

Analytical Skills falls under the General Skills category. For comparison with the information above, the following table provides summary statistics for all contract job vacancies requiring common skills in the Thames Valley.

Contract vacancies with a requirement for common skills 963 1,485 1,831
As % of all contract IT jobs advertised in the Thames Valley 63.73% 55.29% 62.49%
Number of daily rates quoted 584 787 1,231
10th Percentile £265 £205 £303
25th Percentile £409 £325 £400
Median daily rate (50th Percentile) £502 £475 £500
Median % change year-on-year +5.68% -5.00% +5.82%
75th Percentile £613 £588 £601
90th Percentile £700 £675 £700
South East median daily rate £500 £488 £500
% change year-on-year +2.56% -2.50% -
Number of hourly rates quoted 50 137 41
10th Percentile - £17.86 £18.50
25th Percentile £14.20 £22.61 £22.50
Median hourly rate £26.38 £48.40 £32.30
Median % change year-on-year -45.50% +49.85% +84.57%
75th Percentile £61.37 £62.50 £65.00
90th Percentile £71.71 £75.24 £75.75
South East median hourly rate £23.34 £45.00 £47.50
% change year-on-year -48.13% -5.26% +137.50%

Analytical Skills
Job Vacancy Trend in the Thames Valley

Job postings citing Analytical Skills as a proportion of all IT jobs advertised in the Thames Valley.
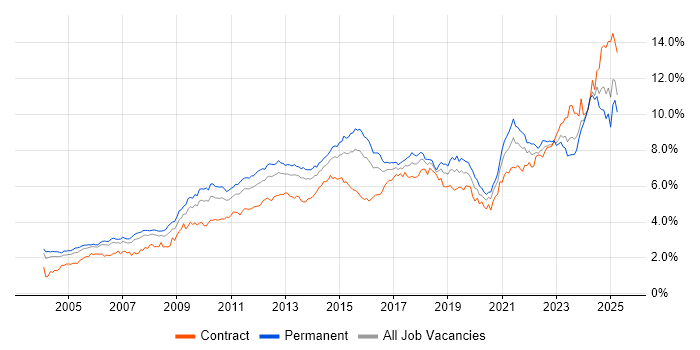
Job vacancy trend for Analytical Skills in the Thames Valley

Analytical Skills
Contractor Daily Rate Trend in the Thames Valley

3-month moving average daily rate quoted in jobs citing Analytical Skills in the Thames Valley.

Daily rate trend for Analytical Skills in the Thames Valley

Analytical Skills
Daily Rate Histogram in the Thames Valley

Daily rate distribution for jobs citing Analytical Skills in the Thames Valley over the 6 months to 1 May 2025.

Daily rate histogram for Analytical Skills in the Thames Valley

Analytical Skills
Contractor Hourly Rate Trend in the Thames Valley

3-month moving average hourly rates quoted in jobs citing Analytical Skills in the Thames Valley.

Hourly rate trend for Analytical Skills in the Thames Valley

Analytical Skills
Hourly Rate Histogram in the Thames Valley

Hourly rate distribution of jobs citing Analytical Skills in the Thames Valley over the 6 months to 1 May 2025.

Hourly rate histogram for Analytical Skills in the Thames Valley

Analytical Skills
Contract Job Locations in the Thames Valley

The table below looks at the demand and provides a guide to the median contractor rates quoted in IT jobs citing Analytical Skills within the Thames Valley region over the 6 months to 1 May 2025. The 'Rank Change' column provides an indication of the change in demand within each location based on the same 6 month period last year.

Location Rank Change
on Same Period
Last Year
Matching
Contract
IT Job Ads
Median
Daily Rate
Past 6 Months
Median Daily Rate
% Change
on Same Period
Last Year
Live
Jobs
Berkshire +9 171 £575 - 254
Buckinghamshire +3 35 £526 +42.23% 190
Oxfordshire +12 17 £500 +2.56% 136
Analytical Skills
South East

Analytical Skills
Co-occurring Skills and Capabilities in the Thames Valley by Category

The follow tables expand on the table above by listing co-occurrences grouped by category. The same employment type, locality and period is covered with up to 20 co-occurrences shown in each of the following categories:

Application Platforms
1 7 (3.14%) Confluence
2 6 (2.69%) SharePoint
3 2 (0.90%) Apache Spark
3 2 (0.90%) BizTalk Server
3 2 (0.90%) Microsoft Exchange
4 1 (0.45%) CMS
4 1 (0.45%) IBM Domino
Applications
1 16 (7.17%) Microsoft Excel
2 8 (3.59%) Microsoft PowerPoint
3 7 (3.14%) Microsoft Office
4 3 (1.35%) MS Visio
5 1 (0.45%) CATIA
5 1 (0.45%) Microsoft Project
5 1 (0.45%) Spreadsheet
Business Applications
1 27 (12.11%) Oracle EBS
2 21 (9.42%) Oracle EBS R12
3 13 (5.83%) Oracle ASCP
4 12 (5.38%) Maximo
5 7 (3.14%) Sparx Enterprise Architect
6 6 (2.69%) SAP S/4HANA
7 4 (1.79%) Oracle ERP
7 4 (1.79%) Oracle Financials
8 2 (0.90%) Oracle Procure-to-Pay
8 2 (0.90%) Remedy ITSM
8 2 (0.90%) SAP Oil and Gas
9 1 (0.45%) Dynamics CRM
9 1 (0.45%) Oracle Applications
9 1 (0.45%) Oracle SCM
9 1 (0.45%) Primavera
Cloud Services
1 52 (23.32%) Azure
2 35 (15.70%) AWS
3 11 (4.93%) GCP
4 10 (4.48%) Power Platform
5 9 (4.04%) Azure DevOps
6 8 (3.59%) Azure Monitor
6 8 (3.59%) Entra ID
7 7 (3.14%) Serverless
8 6 (2.69%) Azure Data Factory
9 5 (2.24%) Azure API Management
9 5 (2.24%) Azure Functions
9 5 (2.24%) OCI
10 4 (1.79%) Azure Cosmos DB
10 4 (1.79%) Microsoft 365
10 4 (1.79%) SaaS
11 3 (1.35%) Azure Service Bus
12 2 (0.90%) Azure Event Grid
12 2 (0.90%) Azure Key Vault
12 2 (0.90%) Azure Logic Apps
12 2 (0.90%) Azure Sentinel
Communications & Networking
1 7 (3.14%) Firewall
1 7 (3.14%) MPLS
1 7 (3.14%) TCP/IP
2 5 (2.24%) BGP
2 5 (2.24%) VLAN
3 4 (1.79%) Diameter Protocol
3 4 (1.79%) Intrusion Detection
3 4 (1.79%) Radio Access Network
3 4 (1.79%) VPN
4 3 (1.35%) Broadband
4 3 (1.35%) HTTP
4 3 (1.35%) LTE
4 3 (1.35%) Wireshark
5 2 (0.90%) 4G
5 2 (0.90%) MVNO
5 2 (0.90%) Network Security
5 2 (0.90%) SAN
5 2 (0.90%) SIGTRAN
5 2 (0.90%) Structured Cabling
5 2 (0.90%) VoLTE
Database & Business Intelligence
1 10 (4.48%) Power BI
2 9 (4.04%) Data Lake
3 5 (2.24%) Data Warehouse
4 4 (1.79%) Azure SQL Database
4 4 (1.79%) NoSQL
4 4 (1.79%) SQL Server
5 3 (1.35%) Power Query
5 3 (1.35%) Relational Database
5 3 (1.35%) SSDT
5 3 (1.35%) Tableau
6 2 (0.90%) Big Data
6 2 (0.90%) Metadata
6 2 (0.90%) Oracle Reports
6 2 (0.90%) PostgreSQL
7 1 (0.45%) Amazon RDS
7 1 (0.45%) DynamoDB
7 1 (0.45%) Impala
7 1 (0.45%) MS Access
7 1 (0.45%) MySQL
7 1 (0.45%) Oracle Database
Development Applications
1 17 (7.62%) JIRA
2 12 (5.38%) Selenium
3 11 (4.93%) Cucumber
4 10 (4.48%) GitLab
4 10 (4.48%) Jenkins
4 10 (4.48%) SonarQube
5 9 (4.04%) REST Assured
6 8 (3.59%) Git
7 7 (3.14%) ERwin
7 7 (3.14%) PowerDesigner
8 5 (2.24%) Robot Framework
9 2 (0.90%) Burp Suite
9 2 (0.90%) Metasploit
9 2 (0.90%) SpecFlow
10 1 (0.45%) DbUnit
10 1 (0.45%) jMock
10 1 (0.45%) JUnit
10 1 (0.45%) Maven
10 1 (0.45%) Mockito
10 1 (0.45%) Oracle Forms
General
1 140 (62.78%) Social Skills
2 45 (20.18%) Finance
3 38 (17.04%) Telecoms
4 28 (12.56%) Retail
5 15 (6.73%) Organisational Skills
6 11 (4.93%) Billing
7 9 (4.04%) Marketing
8 8 (3.59%) Law
9 6 (2.69%) Legal
10 5 (2.24%) Inclusion and Diversity
10 5 (2.24%) Manufacturing
10 5 (2.24%) Police
11 4 (1.79%) Agriculture
11 4 (1.79%) Public Sector
12 3 (1.35%) Automotive
12 3 (1.35%) Influencing Skills
12 3 (1.35%) Presentation Skills
13 2 (0.90%) Documentation Skills
13 2 (0.90%) Electronics
13 2 (0.90%) General Ledger
Job Titles
1 44 (19.73%) Analyst
2 25 (11.21%) Consultant
3 21 (9.42%) Senior
4 20 (8.97%) Oracle Consultant
5 17 (7.62%) Functional Consultant
5 17 (7.62%) Oracle Functional Consultant
6 16 (7.17%) Developer
7 14 (6.28%) Data Analyst
7 14 (6.28%) IT Manager
8 13 (5.83%) Architect
8 13 (5.83%) Operations Manager
9 12 (5.38%) IT Operations Manager
9 12 (5.38%) Project Manager
10 11 (4.93%) Performance Manager
11 10 (4.48%) Lead
12 9 (4.04%) Business Analyst
12 9 (4.04%) Data Manager
13 8 (3.59%) Resilience Manager
14 7 (3.14%) Senior Analyst
14 7 (3.14%) Tester
Libraries, Frameworks & Software Standards
1 18 (8.07%) REST
2 10 (4.48%) ARM Templates
3 9 (4.04%) Java EE
4 7 (3.14%) JSON
4 7 (3.14%) OAuth
5 5 (2.24%) CSS
5 5 (2.24%) HTML
5 5 (2.24%) React
5 5 (2.24%) Web Services
6 3 (1.35%) Oracle Fusion
6 3 (1.35%) SOAP
6 3 (1.35%) YAML
7 2 (0.90%) .NET
7 2 (0.90%) OpenID
7 2 (0.90%) Playwright
7 2 (0.90%) SAML
8 1 (0.45%) .NET Core
8 1 (0.45%) Blazor
8 1 (0.45%) PySpark
8 1 (0.45%) Spring Boot
Miscellaneous
1 14 (6.28%) Self-Motivation
2 13 (5.83%) Management Information System
3 10 (4.48%) Onboarding
4 9 (4.04%) Cloud Native
4 9 (4.04%) Cyber Threat
4 9 (4.04%) Product Ownership
5 8 (3.59%) CSOC
5 8 (3.59%) Data Structures
6 6 (2.69%) Analytical Mindset
6 6 (2.69%) Operational Technology
7 4 (1.79%) Cyberattack
7 4 (1.79%) Life Science
7 4 (1.79%) Security Posture
8 3 (1.35%) CMDB
8 3 (1.35%) Data Protection Act
8 3 (1.35%) Hybrid Cloud
8 3 (1.35%) Legacy Systems
8 3 (1.35%) Security Operations Centre
8 3 (1.35%) Social Media
9 2 (0.90%) Legacy Applications
Operating Systems
1 13 (5.83%) Windows
2 7 (3.14%) Linux
3 4 (1.79%) Unix
4 2 (0.90%) AIX
4 2 (0.90%) Mac OS
4 2 (0.90%) Windows 10
4 2 (0.90%) Windows Server
5 1 (0.45%) Android
5 1 (0.45%) Apple iOS
Processes & Methodologies
1 135 (60.54%) Problem-Solving
2 35 (15.70%) Agile
3 34 (15.25%) Stakeholder Management
4 30 (13.45%) DevOps
5 28 (12.56%) Project Delivery
6 27 (12.11%) Project Management
7 24 (10.76%) Migration
8 23 (10.31%) Roadmaps
9 21 (9.42%) Analytics
9 21 (9.42%) Cybersecurity
10 19 (8.52%) Actionable Insight
10 19 (8.52%) Collaborative Working
10 19 (8.52%) Containerisation
10 19 (8.52%) Test Automation
11 18 (8.07%) ITIL
12 17 (7.62%) Data Analysis
12 17 (7.62%) Data Management
12 17 (7.62%) Decision-Making
12 17 (7.62%) SIEM
13 16 (7.17%) Stakeholder Engagement
Programming Languages
1 25 (11.21%) Python
2 22 (9.87%) SQL
3 20 (8.97%) Java
4 8 (3.59%) C#
5 7 (3.14%) PowerShell
6 6 (2.69%) JavaScript
7 3 (1.35%) C++
7 3 (1.35%) PL/SQL
7 3 (1.35%) VBA
8 2 (0.90%) Bash
8 2 (0.90%) C
8 2 (0.90%) R
8 2 (0.90%) Ruby
9 1 (0.45%) ABAP
9 1 (0.45%) Perl
Qualifications
1 29 (13.00%) Security Cleared
2 24 (10.76%) SC Cleared
3 20 (8.97%) Degree
4 10 (4.48%) PMI Certification
4 10 (4.48%) PMP
5 9 (4.04%) CISSP
6 7 (3.14%) CISM
6 7 (3.14%) DV Cleared
6 7 (3.14%) GIAC
7 6 (2.69%) Computer Science Degree
7 6 (2.69%) Master's Degree
8 5 (2.24%) ACCA
8 5 (2.24%) Azure Certification
9 3 (1.35%) BPSS Clearance
9 3 (1.35%) CEH
9 3 (1.35%) CIMA
9 3 (1.35%) ITIL Certification
10 2 (0.90%) GPEN
10 2 (0.90%) GWAPT
10 2 (0.90%) ISTQB
Quality Assurance & Compliance
1 13 (5.83%) Data Quality
1 13 (5.83%) QA
2 10 (4.48%) GDPR
3 7 (3.14%) NIST
4 6 (2.69%) ISO/IEC 27001
5 5 (2.24%) SLA
6 4 (1.79%) PCI DSS
7 3 (1.35%) Actionable Recommendations
7 3 (1.35%) NCSC
8 2 (0.90%) HIPAA
8 2 (0.90%) IFRS
8 2 (0.90%) PMO
System Software
1 17 (7.62%) Docker
2 10 (4.48%) Active Directory
3 5 (2.24%) Virtual Machines
4 3 (1.35%) Hyper-V
5 2 (0.90%) VMware Infrastructure
6 1 (0.45%) Apache Flume
6 1 (0.45%) Postfix
6 1 (0.45%) VMware ESXi
6 1 (0.45%) VMware NSX
6 1 (0.45%) vSphere
6 1 (0.45%) XenApp
Systems Management
1 19 (8.52%) Kubernetes
2 17 (7.62%) Ansible
3 13 (5.83%) Terraform
4 9 (4.04%) Docker Swarm
4 9 (4.04%) Podman
5 6 (2.69%) SCCM
6 4 (1.79%) Single Sign-On
7 3 (1.35%) Microsoft Intune
7 3 (1.35%) SCOM
8 2 (0.90%) Amdocs OSS
8 2 (0.90%) Grafana
8 2 (0.90%) Progress Chef
8 2 (0.90%) Prometheus
8 2 (0.90%) Puppet
9 1 (0.45%) CASB
9 1 (0.45%) CSIRT
Vendors
1 38 (17.04%) Microsoft
2 35 (15.70%) Oracle
3 16 (7.17%) Splunk
4 15 (6.73%) SAP
5 10 (4.48%) Dynatrace
6 7 (3.14%) Google
6 7 (3.14%) Sparx
7 6 (2.69%) Salesforce
7 6 (2.69%) ServiceNow
7 6 (2.69%) VMware
8 4 (1.79%) Databricks
8 4 (1.79%) Remedy
9 3 (1.35%) Cisco
9 3 (1.35%) IFS
9 3 (1.35%) SolarWinds
9 3 (1.35%) UiPath
9 3 (1.35%) Workday
10 2 (0.90%) BMC
10 2 (0.90%) Cramer
10 2 (0.90%) Infoblox