Azure Contracts in the Thames Valley

Microsoft Azure
South East > Thames Valley

The following table provides summary statistics for contract job vacancies advertised in the Thames Valley with a requirement for Azure skills. Included is a benchmarking guide to the contractor rates offered in vacancies that have cited Azure over the 6 months to 25 April 2024 with a comparison to the same period in the previous 2 years.

6 months to
25 Apr 2024
Same period 2023 Same period 2022
Rank 8 8 8
Rank change year-on-year 0 0 -4
Contract jobs citing Azure 337 416 448
As % of all contract jobs advertised in the Thames Valley 12.47% 14.20% 12.91%
As % of the Cloud Services category 43.26% 49.17% 41.67%
Number of daily rates quoted 259 328 373
10th Percentile £375 £365 £363
25th Percentile £459 £475 £440
Median daily rate (50th Percentile) £550 £550 £550
Median % change year-on-year - - +10.00%
75th Percentile £625 £638 £623
90th Percentile £678 £713 £660
South East median daily rate £550 £550 £525
% change year-on-year - +4.76% +10.53%
Number of hourly rates quoted 13 5 5
10th Percentile £22.97 £56.10 -
25th Percentile £56.50 £61.50 £12.50
Median hourly rate £58.30 £79.19 £15.00
Median % change year-on-year -26.38% +427.93% -40.00%
75th Percentile £61.60 - £87.50
90th Percentile - - -
South East median hourly rate £44.25 £67.50 £50.50
% change year-on-year -34.44% +33.66% +90.57%

All Cloud Skills
Thames Valley

Azure is in the Cloud Services category. The following table is for comparison with the above and provides summary statistics for all contract job vacancies advertised in the Thames Valley with a requirement for cloud computing skills.

Contract vacancies with a requirement for cloud computing skills 779 846 1,075
As % of all contract IT jobs advertised in the Thames Valley 28.83% 28.88% 30.99%
Number of daily rates quoted 520 616 829
10th Percentile £274 £300 £178
25th Percentile £413 £425 £375
Median daily rate (50th Percentile) £500 £525 £500
Median % change year-on-year -4.76% +5.00% +5.26%
75th Percentile £608 £625 £596
90th Percentile £688 £698 £650
South East median daily rate £500 £525 £500
% change year-on-year -4.76% +5.00% +5.26%
Number of hourly rates quoted 31 21 21
10th Percentile £16.00 £17.72 £12.50
25th Percentile £19.74 £21.00 £16.25
Median hourly rate £42.50 £28.16 £21.00
Median % change year-on-year +50.92% +34.10% -0.24%
75th Percentile £60.73 £57.50 £26.50
90th Percentile £61.60 £79.19 £80.40
South East median hourly rate £23.22 £23.23 £21.05
% change year-on-year -0.04% +10.33% -2.21%

Azure
Job Vacancy Trend in the Thames Valley

Job postings citing Azure as a proportion of all IT jobs advertised in the Thames Valley.
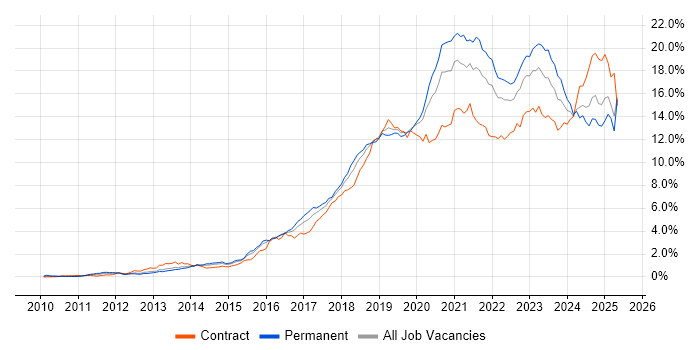
Job vacancy trend for Azure in the Thames Valley

Azure
Contractor Daily Rate Trend in the Thames Valley

3-month moving average daily rate quoted in jobs citing Azure in the Thames Valley.

Daily rate trend for Azure in the Thames Valley

Azure
Daily Rate Histogram in the Thames Valley

Daily rate distribution for jobs citing Azure in the Thames Valley over the 6 months to 25 April 2024.

Daily rate histogram for Azure in the Thames Valley

Azure
Contractor Hourly Rate Trend in the Thames Valley

3-month moving average hourly rates quoted in jobs citing Azure in the Thames Valley.

Hourly rate trend for Azure in the Thames Valley

Azure
Hourly Rate Histogram in the Thames Valley

Hourly rate distribution of jobs citing Azure in the Thames Valley over the 6 months to 25 April 2024.

Hourly rate histogram for Azure in the Thames Valley

Azure
Contract Job Locations in the Thames Valley

The table below looks at the demand and provides a guide to the median contractor rates quoted in IT jobs citing Azure within the Thames Valley region over the 6 months to 25 April 2024. The 'Rank Change' column provides an indication of the change in demand within each location based on the same 6 month period last year.

Location Rank Change
on Same Period
Last Year
Matching
Contract
IT Job Ads
Median
Daily Rate
Past 6 Months
Median Daily Rate
% Change
on Same Period
Last Year
Live
Jobs
Berkshire 0 272 £575 -1.08% 71
Buckinghamshire -8 42 £450 -13.04% 73
Oxfordshire -2 23 £465 +9.41% 47
Azure
South East

Azure
Co-occurring Skills and Capabilities in the Thames Valley by Category

The follow tables expand on the table above by listing co-occurrences grouped by category. The same employment type, locality and period is covered with up to 20 co-occurrences shown in each of the following categories:

Application Platforms
1 26 (7.72%) Microsoft Exchange
2 7 (2.08%) SharePoint
3 3 (0.89%) SAS
4 2 (0.59%) CMS
4 2 (0.59%) Confluence
4 2 (0.59%) Headless CMS
4 2 (0.59%) Kentico
4 2 (0.59%) nginx
5 1 (0.30%) Apache
5 1 (0.30%) Apache Spark
5 1 (0.30%) Jadu
Applications
1 13 (3.86%) Microsoft Excel
2 8 (2.37%) Microsoft Office
3 1 (0.30%) Microsoft Project
3 1 (0.30%) PlantUML
3 1 (0.30%) Spreadsheet
Business Applications
1 18 (5.34%) Oracle Procure-to-Pay
2 9 (2.67%) Oracle EBS R12
3 8 (2.37%) Oracle EBS
3 8 (2.37%) Teamcenter
4 2 (0.59%) Sage X3
4 2 (0.59%) SAP S/4HANA
5 1 (0.30%) Dynamics AX
5 1 (0.30%) Dynamics CRM
5 1 (0.30%) Maximo
5 1 (0.30%) Remedy ITSM
5 1 (0.30%) Sparx Enterprise Architect
Cloud Services
1 90 (26.71%) Azure DevOps
2 52 (15.43%) AWS
3 49 (14.54%) Azure Monitor
4 43 (12.76%) Entra ID
5 36 (10.68%) Azure Data Factory
6 29 (8.61%) Azure Cosmos DB
7 27 (8.01%) Microsoft 365
8 25 (7.42%) Azure Functions
8 25 (7.42%) Serverless
9 24 (7.12%) Power Platform
10 17 (5.04%) PaaS
11 16 (4.75%) Azure Key Vault
12 15 (4.45%) Azure AKS
12 15 (4.45%) Azure Storage
13 14 (4.15%) Azure Logic Apps
14 13 (3.86%) OpenShift
15 12 (3.56%) IaaS
15 12 (3.56%) OCI
16 11 (3.26%) GCP
17 10 (2.97%) Azure API Management
Communications & Networking
1 44 (13.06%) Firewall
2 37 (10.98%) DNS
3 32 (9.50%) DHCP
4 16 (4.75%) SAN
5 9 (2.67%) SSL
6 7 (2.08%) VPN
6 7 (2.08%) WAN
7 4 (1.19%) LAN
7 4 (1.19%) Network Security
7 4 (1.19%) TCP/IP
7 4 (1.19%) Wi-Fi
8 3 (0.89%) Wireless
9 2 (0.59%) Cisco ASA
9 2 (0.59%) Cisco IOS
9 2 (0.59%) Cisco ISE
9 2 (0.59%) Remote Desktop
9 2 (0.59%) SD-WAN
10 1 (0.30%) Cisco Firepower
10 1 (0.30%) Cisco Nexus
10 1 (0.30%) Unified Communications
Database & Business Intelligence
1 23 (6.82%) Power BI
2 20 (5.93%) NoSQL
3 17 (5.04%) Azure SQL Database
4 16 (4.75%) SQL Server
5 15 (4.45%) PostgreSQL
6 12 (3.56%) Redis
7 7 (2.08%) Relational Database
8 5 (1.48%) Data Lake
8 5 (1.48%) MySQL
8 5 (1.48%) SQL Server Integration Services
9 4 (1.19%) Amazon RDS
9 4 (1.19%) Big Data
9 4 (1.19%) GIS
10 3 (0.89%) SAS Enterprise Guide
10 3 (0.89%) Tableau
11 2 (0.59%) Data Warehouse
11 2 (0.59%) RDBMS
11 2 (0.59%) SQL Server Reporting Services
12 1 (0.30%) InterSystems Cache
12 1 (0.30%) Microsoft Analysis Services
Development Applications
1 31 (9.20%) Git
2 25 (7.42%) JIRA
3 23 (6.82%) Selenium
4 19 (5.64%) Jenkins
5 14 (4.15%) GitLab
6 13 (3.86%) Cucumber
6 13 (3.86%) SonarQube
7 12 (3.56%) REST Assured
8 10 (2.97%) Visual Studio
9 7 (2.08%) Oracle Forms
10 6 (1.78%) Postman
10 6 (1.78%) SpecFlow
11 5 (1.48%) Bitbucket
12 4 (1.19%) Artifactory
12 4 (1.19%) Visual Studio Code
13 3 (0.89%) JMeter
13 3 (0.89%) Robot Framework
14 1 (0.30%) Maven
14 1 (0.30%) NUnit
14 1 (0.30%) Xcode
General
1 100 (29.67%) Social Skills
2 55 (16.32%) Analytical Skills
3 21 (6.23%) Finance
4 20 (5.93%) Public Sector
5 11 (3.26%) Presentation Skills
6 10 (2.97%) Law
7 9 (2.67%) Police
7 9 (2.67%) Telecoms
8 7 (2.08%) Organisational Skills
9 6 (1.78%) Manufacturing
10 5 (1.48%) Pharmaceutical
11 3 (0.89%) Marketing
12 2 (0.59%) Automotive
12 2 (0.59%) Documentation Skills
12 2 (0.59%) Legal
12 2 (0.59%) Retail
13 1 (0.30%) Advertising
13 1 (0.30%) Back Office
13 1 (0.30%) Electronics
13 1 (0.30%) General Ledger
Job Titles
1 67 (19.88%) Developer
2 38 (11.28%) Architect
3 33 (9.79%) Senior
4 28 (8.31%) Active Directory Support
5 27 (8.01%) Azure Specialist
6 26 (7.72%) Active Directory Specialist
6 26 (7.72%) Analyst
6 26 (7.72%) Infrastructure Engineer
6 26 (7.72%) Lead
6 26 (7.72%) Support Specialist
7 21 (6.23%) Azure Engineer
8 20 (5.93%) Azure Developer
9 17 (5.04%) Full Stack Developer
10 16 (4.75%) Consultant
11 14 (4.15%) Administrator
12 13 (3.86%) Systems Administrator
13 12 (3.56%) Solutions Architect
14 11 (3.26%) Senior Systems Administrator
15 10 (2.97%) Functional Consultant
15 10 (2.97%) Lead Designer
Libraries, Frameworks & Software Standards
1 34 (10.09%) ARM Templates
2 23 (6.82%) React
3 20 (5.93%) .NET
3 20 (5.93%) Node.js
4 17 (5.04%) REST
5 13 (3.86%) AngularJS
5 13 (3.86%) Itk
5 13 (3.86%) Java EE
6 12 (3.56%) CSS
6 12 (3.56%) HTML
7 11 (3.26%) Web Services
8 8 (2.37%) XML
9 7 (2.08%) YAML
10 6 (1.78%) JSON
11 5 (1.48%) ASP.NET
11 5 (1.48%) Django
12 4 (1.19%) OAuth
12 4 (1.19%) OpenID
12 4 (1.19%) PostGIS
12 4 (1.19%) SOAP
Miscellaneous
1 24 (7.12%) PKI
1 24 (7.12%) Product Ownership
2 18 (5.34%) Self-Motivation
3 15 (4.45%) Data Centre
4 13 (3.86%) Cloud Native
5 11 (3.26%) Data Protection Act
5 11 (3.26%) Public Cloud
6 7 (2.08%) Client/Server
7 6 (1.78%) Management Information System
8 5 (1.48%) Smart Meter
9 3 (0.89%) Onboarding
10 2 (0.59%) CCTV
10 2 (0.59%) IoT
10 2 (0.59%) Legacy Applications
10 2 (0.59%) Legacy Systems
10 2 (0.59%) Robotics
11 1 (0.30%) Data Fabric
11 1 (0.30%) Smartphone
11 1 (0.30%) Taxonomies
11 1 (0.30%) W3C
Operating Systems
1 76 (22.55%) Windows
2 55 (16.32%) Linux
3 54 (16.02%) Windows Server
4 34 (10.09%) Windows Server 2019
5 32 (9.50%) Windows Server 2016
6 21 (6.23%) Windows 10
7 14 (4.15%) Windows Server 2012
8 12 (3.56%) Windows XP
9 9 (2.67%) Red Hat Enterprise Linux
10 4 (1.19%) Unix
11 3 (0.89%) Android
12 2 (0.59%) Mac OS
12 2 (0.59%) Ubuntu
12 2 (0.59%) Windows Server 2008
13 1 (0.30%) Apple iOS
Processes & Methodologies
1 174 (51.63%) DevOps
2 92 (27.30%) Agile
3 69 (20.47%) CI/CD
4 57 (16.91%) Problem-Solving
5 48 (14.24%) Infrastructure as Code
6 40 (11.87%) Test Automation
7 35 (10.39%) Analytics
8 32 (9.50%) ITIL
9 29 (8.61%) Containerisation
9 29 (8.61%) Infrastructure Engineering
9 29 (8.61%) Microservices
10 26 (7.72%) Project Management
11 25 (7.42%) Scrum
12 24 (7.12%) Release Management
13 22 (6.53%) Business Intelligence
13 22 (6.53%) Full Stack Development
13 22 (6.53%) Technical Leadership
14 21 (6.23%) Stakeholder Management
15 20 (5.93%) Continuous Improvement
15 20 (5.93%) Migration
Programming Languages
1 49 (14.54%) PowerShell
2 45 (13.35%) C#
3 42 (12.46%) Python
4 40 (11.87%) SQL
5 23 (6.82%) Java
6 22 (6.53%) VBScript
7 16 (4.75%) Bicep
7 16 (4.75%) C
8 15 (4.45%) VB
9 13 (3.86%) JavaScript
10 9 (2.67%) C++
11 8 (2.37%) PHP
11 8 (2.37%) TypeScript
12 4 (1.19%) T-SQL
13 3 (0.89%) R
14 2 (0.59%) Data Analysis Expressions
14 2 (0.59%) Ruby
15 1 (0.30%) Bash
15 1 (0.30%) Go
15 1 (0.30%) Scala
Qualifications
1 101 (29.97%) Security Cleared
2 69 (20.47%) SC Cleared
3 64 (18.99%) DV Cleared
4 56 (16.62%) Degree
5 16 (4.75%) Cisco Certification
6 15 (4.45%) CCNP
6 15 (4.45%) ITIL Foundation Certificate
7 13 (3.86%) CCNA
8 7 (2.08%) Microsoft Certification
9 5 (1.48%) Azure Certification
10 4 (1.19%) Computer Science Degree
11 3 (0.89%) MCSE
11 3 (0.89%) PMP
12 2 (0.59%) A+ Certification
12 2 (0.59%) BPSS Clearance
12 2 (0.59%) CBAP
12 2 (0.59%) Master's Degree
12 2 (0.59%) MCITP
12 2 (0.59%) PMI Certification
13 1 (0.30%) IIBA
Quality Assurance & Compliance
1 15 (4.45%) QA
2 5 (1.48%) GDPR
2 5 (1.48%) PMO
3 4 (1.19%) Data Quality
4 3 (0.89%) NCSC
4 3 (0.89%) NIST
4 3 (0.89%) SLA
5 2 (0.59%) Accessibility
6 1 (0.30%) COBIT
6 1 (0.30%) ISO/IEC 27001
6 1 (0.30%) PCI DSS
6 1 (0.30%) Sarbanes-Oxley
System Software
1 94 (27.89%) Active Directory
2 32 (9.50%) VMware Infrastructure
3 28 (8.31%) Docker
4 21 (6.23%) Virtual Machines
5 15 (4.45%) Hyper-V
5 15 (4.45%) Virtual Desktop
6 14 (4.15%) VMware ESXi
7 2 (0.59%) vSphere
8 1 (0.30%) Microsoft App-V
Systems Management
1 48 (14.24%) Kubernetes
2 39 (11.57%) SCCM
3 32 (9.50%) Terraform
3 32 (9.50%) WSUS
4 28 (8.31%) SCOM
5 24 (7.12%) Microsoft Intune
6 21 (6.23%) Ansible
7 16 (4.75%) Active Directory Federation Services
8 15 (4.45%) vCenter Server
9 12 (3.56%) Docker Swarm
9 12 (3.56%) EMC NetWorker
9 12 (3.56%) NetBackup
9 12 (3.56%) Podman
10 11 (3.26%) Istio
11 7 (2.08%) Grafana
11 7 (2.08%) Rancher
12 4 (1.19%) Prometheus
13 2 (0.59%) Graylog
13 2 (0.59%) PaperCut
13 2 (0.59%) Single Sign-On
Vendors
1 102 (30.27%) Microsoft
2 43 (12.76%) VMware
3 35 (10.39%) Oracle
4 21 (6.23%) Cisco
5 14 (4.15%) HP
5 14 (4.15%) Palo Alto
5 14 (4.15%) Veeam
6 12 (3.56%) 3PAR
6 12 (3.56%) Dell
6 12 (3.56%) EMC
6 12 (3.56%) Extreme Networks
6 12 (3.56%) Juniper
6 12 (3.56%) Symantec
7 11 (3.26%) Google
8 9 (2.67%) Red Hat
9 8 (2.37%) SAP
10 6 (1.78%) Ab Initio
10 6 (1.78%) Databricks
11 4 (1.19%) Okta
11 4 (1.19%) ServiceNow