Power BI Contracts in the Thames Valley

Microsoft Power BI
South East > Thames Valley

The table below provides summary statistics for contract job vacancies advertised in the Thames Valley requiring Power BI skills. It includes a benchmarking guide to the contractor rates offered in vacancies that cited Power BI over the 6 months leading up to 9 May 2025, comparing them to the same period in the previous two years.

6 months to
9 May 2025
Same period 2024 Same period 2023
Rank 65 66 61
Rank change year-on-year +1 -5 +4
Contract jobs citing Power BI 41 75 92
As % of all contract jobs advertised in the Thames Valley 2.76% 2.84% 3.25%
As % of the Database & Business Intelligence category 18.47% 22.52% 21.50%
Number of daily rates quoted 24 46 57
10th Percentile £276 £243 £252
25th Percentile £341 £328 £350
Median daily rate (50th Percentile) £496 £450 £450
Median % change year-on-year +10.28% - -11.76%
75th Percentile £541 £517 £575
90th Percentile £621 £588 £626
South East median daily rate £469 £450 £475
% change year-on-year +4.17% -5.26% -5.00%
Number of hourly rates quoted 2 4 10
10th Percentile - - £22.45
25th Percentile - £22.61 £27.64
Median hourly rate £32.05 £23.82 £43.65
Median % change year-on-year +34.54% -45.42% +94.00%
75th Percentile - £33.70 £78.33
90th Percentile - £50.38 £79.19
South East median hourly rate £32.05 £23.82 £34.15
% change year-on-year +34.54% -30.24% +64.58%

All Database and Business Intelligence Skills
Thames Valley

Power BI falls under the Databases and Business Intelligence category. For comparison with the information above, the following table provides summary statistics for all contract job vacancies requiring database or business intelligence skills in the Thames Valley.

Contract vacancies with a requirement for database or business intelligence skills 222 333 428
As % of all contract IT jobs advertised in the Thames Valley 14.95% 12.61% 15.10%
Number of daily rates quoted 145 190 287
10th Percentile £325 £313 £327
25th Percentile £413 £400 £422
Median daily rate (50th Percentile) £500 £498 £500
Median % change year-on-year +0.50% -0.50% -
75th Percentile £588 £625 £600
90th Percentile £675 £688 £675
South East median daily rate £500 £489 £515
% change year-on-year +2.30% -5.10% +3.00%
Number of hourly rates quoted 9 15 13
10th Percentile £22.97 £19.59 £22.90
25th Percentile £23.50 £22.61 £26.08
Median hourly rate £32.05 £61.00 £55.00
Median % change year-on-year -47.46% +10.91% +266.67%
75th Percentile £53.75 £61.60 £75.75
90th Percentile £65.62 £65.50 £79.19
South East median hourly rate £32.05 £58.91 £55.00
% change year-on-year -45.59% +7.10% +144.44%

Power BI
Job Vacancy Trend in the Thames Valley

Job postings citing Power BI as a proportion of all IT jobs advertised in the Thames Valley.
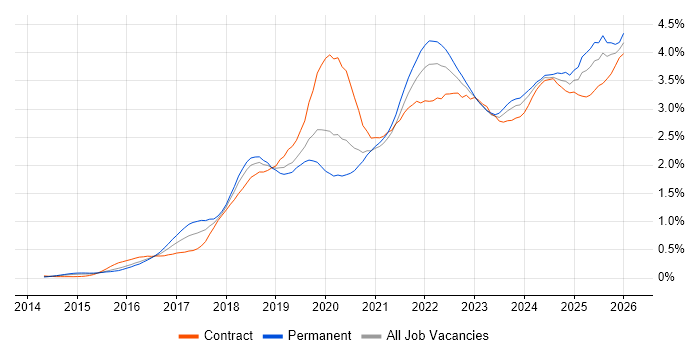
Job vacancy trend for Power BI in the Thames Valley

Power BI
Contractor Daily Rate Trend in the Thames Valley

3-month moving average daily rate quoted in jobs citing Power BI in the Thames Valley.

Daily rate trend for Power BI in the Thames Valley

Power BI
Daily Rate Histogram in the Thames Valley

Daily rate distribution for jobs citing Power BI in the Thames Valley over the 6 months to 9 May 2025.

Daily rate histogram for Power BI in the Thames Valley

Power BI
Contractor Hourly Rate Trend in the Thames Valley

3-month moving average hourly rates quoted in jobs citing Power BI in the Thames Valley.

Hourly rate trend for Power BI in the Thames Valley

Power BI
Contract Job Locations in the Thames Valley

The table below looks at the demand and provides a guide to the median contractor rates quoted in IT jobs citing Power BI within the Thames Valley region over the 6 months to 9 May 2025. The 'Rank Change' column provides an indication of the change in demand within each location based on the same 6 month period last year.

Location Rank Change
on Same Period
Last Year
Matching
Contract
IT Job Ads
Median
Daily Rate
Past 6 Months
Median Daily Rate
% Change
on Same Period
Last Year
Live
Jobs
Berkshire +8 31 £493 +9.44% 40
Oxfordshire +3 5 £356 -20.83% 22
Buckinghamshire -2 5 £575 +27.78% 26
Power BI
South East

Power BI
Co-occurring Skills and Capabilities in the Thames Valley by Category

The follow tables expand on the table above by listing co-occurrences grouped by category. The same employment type, locality and period is covered with up to 20 co-occurrences shown in each of the following categories:

Application Platforms
1 13 (31.71%) SharePoint
2 2 (4.88%) CMS
3 1 (2.44%) Apache Spark
3 1 (2.44%) SAS
Applications
1 12 (29.27%) Microsoft Excel
2 2 (4.88%) Microsoft Office
2 2 (4.88%) Microsoft PowerPoint
2 2 (4.88%) MS Visio
Business Applications
1 2 (4.88%) Sparx Enterprise Architect
2 1 (2.44%) Dynamics CRM
2 1 (2.44%) NetSuite
2 1 (2.44%) SAP S/4HANA
Cloud Services
1 41 (100.00%) Power Platform
2 13 (31.71%) Azure
3 9 (21.95%) Microsoft 365
4 7 (17.07%) Dynamics 365
5 6 (14.63%) AWS
6 4 (9.76%) Azure DevOps
6 4 (9.76%) Azure Storage
6 4 (9.76%) Power Automate
7 3 (7.32%) Azure AKS
7 3 (7.32%) Azure Monitor
7 3 (7.32%) Azure Table
7 3 (7.32%) PowerApps
7 3 (7.32%) Snowflake
8 2 (4.88%) Azure Data Factory
9 1 (2.44%) Amazon ELB
9 1 (2.44%) Azure Functions
9 1 (2.44%) GCP
9 1 (2.44%) Lucidchart
9 1 (2.44%) SaaS
9 1 (2.44%) Serverless
Communications & Networking
1 3 (7.32%) Radio Access Network
2 1 (2.44%) DNS
2 1 (2.44%) HTTP
Database & Business Intelligence
1 9 (21.95%) Tableau
2 6 (14.63%) Power Query
3 5 (12.20%) SQL Server
4 4 (9.76%) Azure SQL Database
4 4 (9.76%) Data Warehouse
5 2 (4.88%) Big Data
5 2 (4.88%) Hadoop
5 2 (4.88%) Impala
6 1 (2.44%) Apache Cassandra
6 1 (2.44%) Apache Hive
6 1 (2.44%) Crystal Reports
6 1 (2.44%) Data Lake
6 1 (2.44%) HBase
6 1 (2.44%) HDInsight
6 1 (2.44%) Metadata
6 1 (2.44%) Microsoft Analysis Services
6 1 (2.44%) PostgreSQL
6 1 (2.44%) Sisense
6 1 (2.44%) SQL Server Analysis Services
6 1 (2.44%) SQL Server Reporting Services
Development Applications
1 3 (7.32%) ERwin
2 1 (2.44%) Git
2 1 (2.44%) Postman
General
1 9 (21.95%) Analytical Skills
2 8 (19.51%) Social Skills
3 7 (17.07%) Finance
4 4 (9.76%) Telecoms
5 3 (7.32%) Manufacturing
5 3 (7.32%) Publishing
6 2 (4.88%) Inclusion and Diversity
6 2 (4.88%) Public Sector
7 1 (2.44%) Documentation Skills
7 1 (2.44%) Electronics
7 1 (2.44%) French Language
7 1 (2.44%) Games
7 1 (2.44%) Italian Language
7 1 (2.44%) Local Government
7 1 (2.44%) Marketing
7 1 (2.44%) Retail
7 1 (2.44%) Spanish Language
Job Titles
1 13 (31.71%) Analyst
2 10 (24.39%) Data Analyst
3 8 (19.51%) Developer
4 5 (12.20%) Senior
5 4 (9.76%) Business Analyst
5 4 (9.76%) Business Intelligence Developer
5 4 (9.76%) Data Business Analyst
5 4 (9.76%) Senior Developer
6 3 (7.32%) Architect
6 3 (7.32%) Azure DevOps Engineer
6 3 (7.32%) Azure Engineer
6 3 (7.32%) DevOps Engineer
6 3 (7.32%) Power BI Developer
6 3 (7.32%) Report Developer
6 3 (7.32%) Site Engineer
6 3 (7.32%) Site Reliability Engineer
6 3 (7.32%) SQL Analyst
6 3 (7.32%) SQL Data Analyst
7 2 (4.88%) Consultant
7 2 (4.88%) Trainer
Libraries, Frameworks & Software Standards
1 4 (9.76%) .NET
1 4 (9.76%) ARM Templates
2 3 (7.32%) .NET Core
2 3 (7.32%) ADO
3 2 (4.88%) Kafka
4 1 (2.44%) .NET Framework
4 1 (2.44%) MDX
4 1 (2.44%) PySpark
4 1 (2.44%) SAP Fiori
Miscellaneous
1 5 (12.20%) Self-Motivation
2 3 (7.32%) Low-Code
3 2 (4.88%) Data Protection Act
3 2 (4.88%) Learning Management System
3 2 (4.88%) Legacy Systems
3 2 (4.88%) Life Science
3 2 (4.88%) Management Information System
3 2 (4.88%) Renewable Energy
4 1 (2.44%) Greenfield Project
4 1 (2.44%) IoT
4 1 (2.44%) Onboarding
4 1 (2.44%) Public Cloud
4 1 (2.44%) Team-Oriented Environment
Operating Systems
1 2 (4.88%) Windows
2 1 (2.44%) Linux
2 1 (2.44%) Unix
Processes & Methodologies
1 41 (100.00%) Business Intelligence
2 13 (31.71%) Analytics
3 11 (26.83%) Data Analysis
4 10 (24.39%) Data Modelling
5 7 (17.07%) Decision-Making
6 6 (14.63%) Collaborative Working
6 6 (14.63%) Problem-Solving
7 5 (12.20%) DevOps
7 5 (12.20%) ERP
8 4 (9.76%) Actionable Insight
8 4 (9.76%) Agile
8 4 (9.76%) Change Management
8 4 (9.76%) Data Governance
8 4 (9.76%) Data Management
8 4 (9.76%) Data-Driven Decision Making
8 4 (9.76%) ETL
8 4 (9.76%) Performance Tuning
8 4 (9.76%) Time Management
8 4 (9.76%) Workflow
9 3 (7.32%) Site Reliability Engineering
Programming Languages
1 17 (41.46%) SQL
2 7 (17.07%) Python
3 4 (9.76%) C#
4 3 (7.32%) Bash
4 3 (7.32%) Bicep
4 3 (7.32%) PowerShell
4 3 (7.32%) R
4 3 (7.32%) VBA
5 2 (4.88%) Data Analysis Expressions
6 1 (2.44%) ABAP
6 1 (2.44%) Perl
6 1 (2.44%) T-SQL
6 1 (2.44%) XMLA
Qualifications
1 5 (12.20%) Degree
2 4 (9.76%) Azure Certification
2 4 (9.76%) SC Cleared
2 4 (9.76%) Security Cleared
3 3 (7.32%) Microsoft Certification
4 1 (2.44%) Computer Science Degree
4 1 (2.44%) Master's Degree
4 1 (2.44%) MBA
4 1 (2.44%) PMI Certification
4 1 (2.44%) PMP
4 1 (2.44%) Six Sigma Black Belt
4 1 (2.44%) Six Sigma Green Belt
4 1 (2.44%) Six Sigma Master Black Belt
Quality Assurance & Compliance
1 4 (9.76%) QA
2 2 (4.88%) Data Quality
3 1 (2.44%) GDPR
3 1 (2.44%) PMO
System Software
1 1 (2.44%) Apache Flume
1 1 (2.44%) Virtual Machines
Systems Management
1 3 (7.32%) Grafana
1 3 (7.32%) Kubernetes
1 3 (7.32%) Prometheus
1 3 (7.32%) Terraform
Vendors
1 19 (46.34%) Microsoft
2 4 (9.76%) Oracle
2 4 (9.76%) Salesforce
3 2 (4.88%) Databricks
3 2 (4.88%) Google
3 2 (4.88%) SAP
3 2 (4.88%) Sparx
3 2 (4.88%) Workday
4 1 (2.44%) Capita
4 1 (2.44%) MicroStrategy
4 1 (2.44%) OpenAI
4 1 (2.44%) StreamSets