Project Management Office Administrator
UK
The median Project Management Office Administrator daily rate in the UK is £200, according to job vacancies posted in the 6 months leading up to 16 November 2025.
The table below compares current contractor rates and summary statistics with the previous two years.
| 6 months to 16 Nov 2025 |
Same period 2024 | Same period 2023 | |
|---|---|---|---|
| Rank | 580 | 556 | 625 |
| Rank change year-on-year | -24 | +69 | +190 |
| Contract jobs requiring a PMO Administrator | 6 | 8 | 6 |
| As % of all contract jobs in the UK | 0.017% | 0.022% | 0.013% |
| As % of the Job Titles category | 0.019% | 0.024% | 0.014% |
| Number of daily rates quoted | 5 | 6 | 5 |
| 10th Percentile | £106 | £219 | £155 |
| 25th Percentile | - | £288 | £163 |
| Median daily rate (50th Percentile) | £200 | £375 | £225 |
| Median % change year-on-year | -46.67% | +66.67% | -16.28% |
| 75th Percentile | £288 | £388 | £238 |
| 90th Percentile | £339 | £394 | £319 |
| UK excluding London median daily rate | £320 | £375 | £225 |
| % change year-on-year | -14.67% | +66.67% | -25.93% |
All Contract IT Job Vacancies
UK
For comparison with the information above, the following table provides summary statistics for all contract IT job vacancies. Most job vacancies include a discernible job title that can be normalized. As such, the figures in the second row provide an indication of the number of contract jobs in our overall sample.
| Contract vacancies in the UK with a recognized job title | 32,121 | 33,965 | 44,165 |
| % of contract IT jobs with a recognized job title | 90.96% | 92.87% | 93.67% |
| Number of daily rates quoted | 20,371 | 20,492 | 29,993 |
| 10th Percentile | £278 | £300 | £294 |
| 25th Percentile | £402 | £410 | £413 |
| Median daily rate (50th Percentile) | £500 | £525 | £525 |
| Median % change year-on-year | -4.76% | - | -4.55% |
| 75th Percentile | £619 | £638 | £650 |
| 90th Percentile | £725 | £738 | £743 |
| UK excluding London median daily rate | £475 | £490 | £500 |
| % change year-on-year | -3.06% | -2.00% | - |
| Number of hourly rates quoted | 1,875 | 1,270 | 1,571 |
| 10th Percentile | £14.22 | £15.10 | £15.12 |
| 25th Percentile | £17.87 | £20.30 | £19.06 |
| Median hourly rate | £25.15 | £36.00 | £44.50 |
| Median % change year-on-year | -30.14% | -19.10% | +58.28% |
| 75th Percentile | £53.99 | £65.00 | £65.00 |
| 90th Percentile | £70.00 | £73.75 | £77.00 |
| UK excluding London median hourly rate | £25.15 | £35.00 | £44.50 |
| % change year-on-year | -28.14% | -21.35% | +85.11% |
PMO Administrator
Job Vacancy Trend
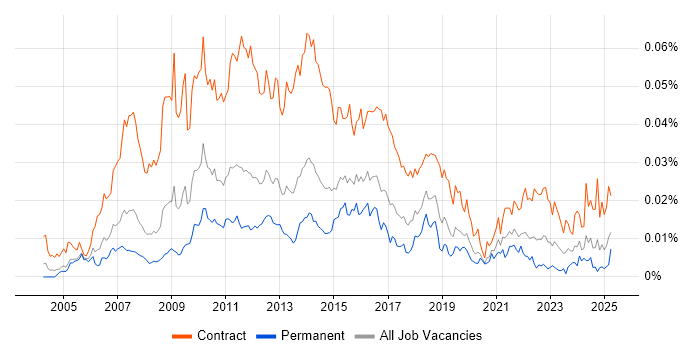
Historical trend showing the proportion of contract IT job postings featuring 'PMO Administrator' in the job title relative to all contract IT jobs advertised.

PMO Administrator
Daily Rate Trend
Contractor daily rate distribution trend for PMO Administrator job vacancies in the UK.

PMO Administrator
Daily Rate Histogram
Daily rate distribution for jobs citing PMO Administrator over the 6 months to 16 November 2025.
PMO Administrator
Hourly Rate Trend
Contractor hourly rate distribution trend for PMO Administrator job vacancies in the UK.

PMO Administrator
Top 6 Contract Job Locations
The table below looks at the demand and provides a guide to the median contractor rates quoted in IT jobs citing PMO Administrator within the UK over the 6 months to 16 November 2025. The 'Rank Change' column provides an indication of the change in demand within each location based on the same 6 month period last year.
| Location | Rank Change on Same Period Last Year |
Matching Contract IT Job Ads |
Median Daily Rate Past 6 Months |
Median Daily Rate % Change on Same Period Last Year |
Live Jobs |
|---|---|---|---|---|---|
| England | -21 | 5 | £238 | -36.67% | 3 |
| London | -2 | 3 | £122 | - | |
| Work from Home | +16 | 2 | £283 | - | 3 |
| West Midlands | -22 | 2 | £320 | +16.36% | 3 |
| Midlands | -32 | 2 | £320 | +16.36% | 3 |
| UK excluding London | -33 | 2 | £320 | -14.67% | 3 |
PMO Administrator Skill Set
Top 22 Co-Occurring Skills & Capabilities
For the 6 months to 16 November 2025, PMO Administrator contract job roles required the following skills and capabilities in order of popularity. The figures indicate the absolute number of co-occurrences and as a proportion of all contract job ads featuring PMO Administrator in the job title.
|
|
PMO Administrator Skill Set
Co-Occurring Skills & Capabilities by Category
The following tables expand on the one above by listing co-occurrences grouped by category. They cover the same employment type, locality and period, with up to 20 co-occurrences shown in each category:
|
|
||||||||||||||||||||||||||||||||||||||||||||||||
|
|
||||||||||||||||||||||||||||||||||||||||||||||||
|
|
||||||||||||||||||||||||||||||||||||||||||||||||
|
|
||||||||||||||||||||||||||||||||||||||||||||||||
|
|||||||||||||||||||||||||||||||||||||||||||||||||
