PaaS Jobs in Bristol

Platform as a Service (PaaS)
South West > Bristol

The table below provides summary statistics for permanent job vacancies advertised in Bristol requiring PaaS skills. It includes a benchmarking guide to the annual salaries offered in vacancies that cited PaaS over the 6 months leading up to 28 May 2025, comparing them to the same period in the previous two years.

6 months to
28 May 2025
Same period 2024 Same period 2023
Rank 80 113 86
Rank change year-on-year +33 -27 +55
Permanent jobs citing PaaS 16 43 87
As % of all permanent jobs advertised in Bristol 1.37% 1.33% 3.38%
As % of the Cloud Services category 4.76% 4.06% 8.02%
Number of salaries quoted 15 41 19
10th Percentile £47,550 £52,500 £35,483
25th Percentile £56,250 £57,500 £43,124
Median annual salary (50th Percentile) £71,991 £75,000 £59,526
Median % change year-on-year -4.01% +26.00% -16.91%
75th Percentile £73,886 £87,500 £65,188
90th Percentile £93,778 - £85,000
South West median annual salary £71,991 £62,500 £57,263
% change year-on-year +15.19% +9.15% -2.53%

All Cloud Skills
Bristol

PaaS falls under the Cloud Services category. For comparison with the information above, the following table provides summary statistics for all permanent job vacancies requiring cloud computing skills in Bristol.

Permanent vacancies with a requirement for cloud computing skills 336 1,060 1,085
As % of all permanent jobs advertised in Bristol 28.67% 32.75% 42.10%
Number of salaries quoted 276 824 685
10th Percentile £40,466 £32,000 £35,733
25th Percentile £47,500 £42,500 £46,250
Median annual salary (50th Percentile) £62,500 £59,500 £60,000
Median % change year-on-year +5.04% -0.83% +5.73%
75th Percentile £82,500 £75,000 £77,500
90th Percentile £95,000 £87,500 £92,000
South West median annual salary £55,000 £52,500 £55,000
% change year-on-year +4.76% -4.55% +4.76%

PaaS
Job Vacancy Trend in Bristol

Job postings citing PaaS as a proportion of all IT jobs advertised in Bristol.
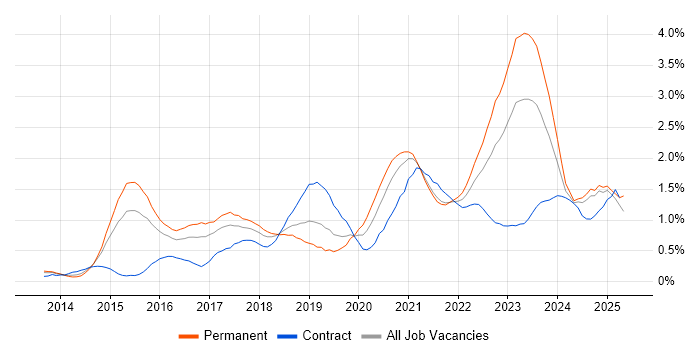
Job vacancy trend for PaaS in Bristol

PaaS
Salary Trend in Bristol

3-month moving average salary quoted in jobs citing PaaS in Bristol.

Salary trend for PaaS in Bristol

PaaS
Salary Histogram in Bristol

Salary distribution for jobs citing PaaS in Bristol over the 6 months to 28 May 2025.

Salary histogram for PaaS in Bristol

PaaS
Co-occurring Skills and Capabilities in Bristol by Category

The follow tables expand on the table above by listing co-occurrences grouped by category. The same employment type, locality and period is covered with up to 20 co-occurrences shown in each of the following categories:

Application Platforms
1 2 (12.50%) SharePoint
2 1 (6.25%) NetWeaver
2 1 (6.25%) Tomcat
Business Applications
1 1 (6.25%) Oracle Subledger Accounting
Cloud Services
1 12 (75.00%) Azure
2 9 (56.25%) SaaS
3 6 (37.50%) Apigee
3 6 (37.50%) IaaS
4 5 (31.25%) Entra ID
5 3 (18.75%) AWS
5 3 (18.75%) Cloud Computing
5 3 (18.75%) OCI
6 2 (12.50%) Azure DevOps
6 2 (12.50%) Microsoft 365
6 2 (12.50%) OneDrive
6 2 (12.50%) Serverless
7 1 (6.25%) Azure AI
7 1 (6.25%) Azure ExpressRoute
7 1 (6.25%) Azure Key Vault
7 1 (6.25%) Azure Monitor
7 1 (6.25%) Azure Service Bus
7 1 (6.25%) Power Automate
7 1 (6.25%) Power Platform
Communications & Networking
1 3 (18.75%) DNS
1 3 (18.75%) Firewall
2 2 (12.50%) DHCP
2 2 (12.50%) Network Security
3 1 (6.25%) SD-WAN
3 1 (6.25%) VPN
3 1 (6.25%) WAN
Database & Business Intelligence
1 1 (6.25%) BusinessObjects
1 1 (6.25%) Data Lake
1 1 (6.25%) MySQL
1 1 (6.25%) Power BI
1 1 (6.25%) SAP BW
1 1 (6.25%) SAP Data Services
1 1 (6.25%) SAP HANA
1 1 (6.25%) SQL Server
Development Applications
1 4 (25.00%) Oracle Forms
2 1 (6.25%) Git
General
1 12 (75.00%) Finance
2 10 (62.50%) Banking
3 3 (18.75%) Analytical Skills
3 3 (18.75%) Organisational Skills
3 3 (18.75%) Social Skills
4 1 (6.25%) General Ledger
4 1 (6.25%) Presentation Skills
4 1 (6.25%) Public Sector
Job Titles
1 7 (43.75%) Architect
2 6 (37.50%) Solutions Architect
3 3 (18.75%) Platform Engineer
3 3 (18.75%) Release Engineer
4 2 (12.50%) Automation Engineer
4 2 (12.50%) Cloud Automation Engineer
4 2 (12.50%) Cloud Engineer
4 2 (12.50%) IT Engineer
4 2 (12.50%) IT Security Engineer
4 2 (12.50%) Security Engineer
5 1 (6.25%) Cloud Architect
5 1 (6.25%) DevOps Engineer
5 1 (6.25%) Infrastructure Engineer
5 1 (6.25%) Unix Engineer
5 1 (6.25%) Unix Infrastructure Engineer
Libraries, Frameworks & Software Standards
1 6 (37.50%) AngularJS
1 6 (37.50%) React
1 6 (37.50%) React Native
2 3 (18.75%) Oracle Fusion
3 1 (6.25%) Web Services
Miscellaneous
1 6 (37.50%) DataPower
1 6 (37.50%) Product Ownership
2 3 (18.75%) Management Information System
3 2 (12.50%) Hybrid Cloud
3 2 (12.50%) Security Posture
4 1 (6.25%) Data Centre
4 1 (6.25%) NHS
Operating Systems
1 6 (37.50%) Android
1 6 (37.50%) Apple iOS
2 1 (6.25%) AIX
2 1 (6.25%) Linux
2 1 (6.25%) Red Hat Enterprise Linux
2 1 (6.25%) Unix
2 1 (6.25%) Windows Server
Processes & Methodologies
1 12 (75.00%) Agile
2 8 (50.00%) Security Architecture
3 7 (43.75%) API Management
3 7 (43.75%) Roadmaps
4 6 (37.50%) Adaptive Web Design
4 6 (37.50%) Containerisation
4 6 (37.50%) Event-Driven
4 6 (37.50%) Event-Driven Architecture
4 6 (37.50%) Microservices
4 6 (37.50%) Technology Roadmap
5 5 (31.25%) DevOps
6 4 (25.00%) CI/CD
6 4 (25.00%) Continuous Improvement
6 4 (25.00%) Infrastructure as Code
6 4 (25.00%) Project Management
7 3 (18.75%) Analytics
7 3 (18.75%) Problem-Solving
7 3 (18.75%) Process Improvement
7 3 (18.75%) RBAC
7 3 (18.75%) Release Management
Programming Languages
1 7 (43.75%) Java
2 4 (25.00%) PowerShell
3 1 (6.25%) Bash
3 1 (6.25%) Bicep
3 1 (6.25%) C
3 1 (6.25%) Python
3 1 (6.25%) SQL
Qualifications
1 1 (6.25%) Azure Certification
1 1 (6.25%) DBS Check
1 1 (6.25%) Degree
Quality Assurance & Compliance
1 3 (18.75%) QA
2 2 (12.50%) ISO/IEC 27001
2 2 (12.50%) ISO/IEC 27002 (supersedes ISO/IEC 17799)
2 2 (12.50%) NIST
System Software
1 4 (25.00%) Active Directory
2 1 (6.25%) Virtual Machines
Systems Management
1 2 (12.50%) Host Intrusion Detection System
1 2 (12.50%) Microsoft Intune
2 1 (6.25%) Single Sign-On
2 1 (6.25%) Tivoli Storage Manager
Vendors
1 8 (50.00%) Microsoft
2 7 (43.75%) IBM
3 6 (37.50%) Apple
4 4 (25.00%) Oracle
5 2 (12.50%) VMware
6 1 (6.25%) Databricks
6 1 (6.25%) Meraki
6 1 (6.25%) SAP