Java Jobs in Bristol

Java
South West > Bristol

The table below provides summary statistics for permanent job vacancies advertised in Bristol requiring Java skills. It includes a benchmarking guide to the annual salaries offered in vacancies that cited Java over the 6 months leading up to 1 May 2025, comparing them to the same period in the previous two years.

6 months to
1 May 2025
Same period 2024 Same period 2023
Rank 21 28 22
Rank change year-on-year +7 -6 -10
Permanent jobs citing Java 102 223 274
As % of all permanent jobs advertised in Bristol 8.15% 7.18% 10.33%
As % of the Programming Languages category 20.86% 19.77% 23.62%
Number of salaries quoted 70 201 148
10th Percentile £47,007 £41,250 £43,750
25th Percentile £52,524 £46,250 £52,000
Median annual salary (50th Percentile) £62,500 £62,500 £65,000
Median % change year-on-year - -3.85% +13.04%
75th Percentile £81,563 £75,000 £77,715
90th Percentile £114,193 £91,934 £89,781
South West median annual salary £60,000 £57,500 £60,000
% change year-on-year +4.35% -4.17% +9.09%

All Programming Languages
Bristol

Java falls under the Programming Languages category. For comparison with the information above, the following table provides summary statistics for all permanent job vacancies requiring coding skills in Bristol.

Permanent vacancies with a requirement for coding skills 489 1,128 1,160
As % of all permanent jobs advertised in Bristol 39.09% 36.34% 43.72%
Number of salaries quoted 398 946 762
10th Percentile £40,313 £38,750 £37,137
25th Percentile £47,500 £46,250 £45,000
Median annual salary (50th Percentile) £57,443 £60,000 £60,000
Median % change year-on-year -4.26% - +9.09%
75th Percentile £73,886 £73,886 £75,000
90th Percentile £89,125 £87,500 £87,500
South West median annual salary £52,600 £55,000 £55,000
% change year-on-year -4.36% - +4.76%

Java
Job Vacancy Trend in Bristol

Job postings citing Java as a proportion of all IT jobs advertised in Bristol.
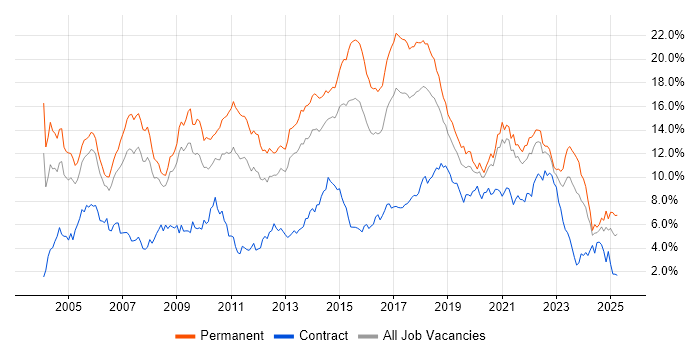
Job vacancy trend for Java in Bristol

Java
Salary Trend in Bristol

3-month moving average salary quoted in jobs citing Java in Bristol.

Salary trend for Java in Bristol

Java
Salary Histogram in Bristol

Salary distribution for jobs citing Java in Bristol over the 6 months to 1 May 2025.

Salary histogram for Java in Bristol

Java
Co-occurring Skills and Capabilities in Bristol by Category

The follow tables expand on the table above by listing co-occurrences grouped by category. The same employment type, locality and period is covered with up to 20 co-occurrences shown in each of the following categories:

Application Platforms
1 5 (4.90%) NetWeaver
1 5 (4.90%) Tomcat
2 3 (2.94%) Apache
Business Applications
1 5 (4.90%) Oracle Subledger Accounting
Cloud Services
1 48 (47.06%) Azure
2 43 (42.16%) AWS
3 24 (23.53%) GCP
4 11 (10.78%) PaaS
5 8 (7.84%) Apigee
5 8 (7.84%) npm
6 6 (5.88%) GitHub
7 5 (4.90%) IaaS
8 4 (3.92%) Amazon EC2
8 4 (3.92%) Amazon S3
8 4 (3.92%) AWS Lambda
8 4 (3.92%) Serverless
9 2 (1.96%) Akamai
9 2 (1.96%) Azure Data Factory
9 2 (1.96%) Azure DevOps
9 2 (1.96%) BrowserStack
9 2 (1.96%) Google Kubernetes Engine
9 2 (1.96%) SaaS
9 2 (1.96%) Sauce Labs
9 2 (1.96%) Stackdriver
Communications & Networking
1 7 (6.86%) SSL
2 2 (1.96%) Reverse Proxy
Database & Business Intelligence
1 21 (20.59%) NoSQL
2 5 (4.90%) BusinessObjects
2 5 (4.90%) SAP BW
2 5 (4.90%) SAP Data Services
2 5 (4.90%) SAP HANA
2 5 (4.90%) SQL Server
3 2 (1.96%) Amazon RDS
3 2 (1.96%) Big Data
3 2 (1.96%) DynamoDB
3 2 (1.96%) MongoDB
3 2 (1.96%) PostgreSQL
Development Applications
1 22 (21.57%) Git
2 12 (11.76%) GitLab
3 10 (9.80%) Sonatype Nexus
4 8 (7.84%) Cucumber
4 8 (7.84%) Cypress.io
4 8 (7.84%) webpack
5 6 (5.88%) Jenkins
6 5 (4.90%) Oracle Forms
7 4 (3.92%) Maven
8 3 (2.94%) Eclipse
8 3 (2.94%) Eclipse RCP
9 2 (1.96%) Appium
9 2 (1.96%) JUnit
9 2 (1.96%) SonarQube
10 1 (0.98%) JIRA
10 1 (0.98%) SoapUI
General
1 56 (54.90%) Finance
2 41 (40.20%) Banking
3 23 (22.55%) Social Skills
4 11 (10.78%) Analytical Skills
4 11 (10.78%) Electronics
5 5 (4.90%) General Ledger
5 5 (4.90%) Legal
6 4 (3.92%) Public Sector
7 3 (2.94%) Manufacturing
7 3 (2.94%) Marketing
7 3 (2.94%) Retail
7 3 (2.94%) Telecoms
8 2 (1.96%) Tech for Good
9 1 (0.98%) Financial Institution
9 1 (0.98%) Games
9 1 (0.98%) Inclusion and Diversity
Job Titles
1 43 (42.16%) Software Engineer
2 20 (19.61%) Lead
3 16 (15.69%) Developer
4 14 (13.73%) Senior
5 10 (9.80%) Java Engineer
5 10 (9.80%) Lead Java Engineer
5 10 (9.80%) Senior Software Engineer
6 9 (8.82%) Full-Stack Engineer
6 9 (8.82%) Full-Stack Software Engineer
7 8 (7.84%) Full-Stack Developer
7 8 (7.84%) Software Developer
8 7 (6.86%) Development Manager
9 6 (5.88%) Architect
9 6 (5.88%) Software Team Leader
9 6 (5.88%) Solutions Architect
9 6 (5.88%) Team Leader
10 5 (4.90%) Graduate
10 5 (4.90%) Infrastructure Engineer
10 5 (4.90%) Unix Engineer
10 5 (4.90%) Unix Infrastructure Engineer
Libraries, Frameworks & Software Standards
1 28 (27.45%) React
2 23 (22.55%) Spring Boot
3 16 (15.69%) Spring
4 15 (14.71%) AngularJS
4 15 (14.71%) RESTful
5 14 (13.73%) Web Services
6 11 (10.78%) Node.js
7 9 (8.82%) OAuth
7 9 (8.82%) REST
8 8 (7.84%) Jest
9 7 (6.86%) Android Jetpack
9 7 (6.86%) GraphQL
9 7 (6.86%) Jetpack Compose
9 7 (6.86%) SwiftUI
9 7 (6.86%) UIKit
9 7 (6.86%) Vue
10 6 (5.88%) React Native
11 5 (4.90%) .NET
11 5 (4.90%) CSS
12 4 (3.92%) ASP.NET
Miscellaneous
1 12 (11.76%) Cloud Native
1 12 (11.76%) Legacy Systems
1 12 (11.76%) Public Cloud
2 10 (9.80%) Data Structures
3 8 (7.84%) Algorithms
3 8 (7.84%) Distributed Applications
3 8 (7.84%) Private Cloud
4 7 (6.86%) Product Ownership
4 7 (6.86%) Virtual Team
5 6 (5.88%) DataPower
6 5 (4.90%) Hackathon
6 5 (4.90%) Learning Management System
6 5 (4.90%) Mobile App
6 5 (4.90%) Self-Motivation
7 4 (3.92%) Reference Data
8 2 (1.96%) Analytical Mindset
8 2 (1.96%) Distributed Systems
8 2 (1.96%) PKI
8 2 (1.96%) Replication
9 1 (0.98%) Housing Association
Operating Systems
1 21 (20.59%) Apple iOS
2 13 (12.75%) Android
2 13 (12.75%) Linux
3 11 (10.78%) Windows
4 7 (6.86%) Unix
5 5 (4.90%) AIX
5 5 (4.90%) Red Hat Enterprise Linux
5 5 (4.90%) Windows Server
Processes & Methodologies
1 61 (59.80%) Software Engineering
2 51 (50.00%) Agile
3 34 (33.33%) Test Automation
4 29 (28.43%) Full-Stack Development
5 27 (26.47%) CI/CD
5 27 (26.47%) Microservices
6 26 (25.49%) Containerisation
7 22 (21.57%) Mentoring
8 17 (16.67%) Problem-Solving
8 17 (16.67%) Roadmaps
9 16 (15.69%) DevOps
9 16 (15.69%) Event-Driven
10 15 (14.71%) Computer Science
11 14 (13.73%) Event-Driven Architecture
12 13 (12.75%) Infrastructure as Code
13 12 (11.76%) Continuous Integration
13 12 (11.76%) OO
14 11 (10.78%) Business Intelligence
14 11 (10.78%) Cybersecurity
14 11 (10.78%) iOS Development
Programming Languages
1 36 (35.29%) Python
2 33 (32.35%) JavaScript
2 33 (32.35%) SQL
3 19 (18.63%) C#
4 12 (11.76%) Kotlin
5 9 (8.82%) TypeScript
6 8 (7.84%) Bash
6 8 (7.84%) C++
7 7 (6.86%) Swift
8 5 (4.90%) C
9 4 (3.92%) Go
10 3 (2.94%) Clojure
10 3 (2.94%) Rust
11 2 (1.96%) PowerShell
11 2 (1.96%) Ruby
12 1 (0.98%) Ada
Qualifications
1 15 (14.71%) Degree
1 15 (14.71%) Security Cleared
2 9 (8.82%) SC Cleared
3 6 (5.88%) Master's Degree
4 5 (4.90%) PhD
5 3 (2.94%) BPSS Clearance
5 3 (2.94%) DV Cleared
6 2 (1.96%) Computer Science Degree
7 1 (0.98%) ISTQB
Quality Assurance & Compliance
1 5 (4.90%) QA
2 2 (1.96%) NIST
3 1 (0.98%) Accessibility
System Software
1 22 (21.57%) Docker
Systems Management
1 14 (13.73%) Kubernetes
2 6 (5.88%) Terraform
3 5 (4.90%) Tivoli Storage Manager
4 2 (1.96%) Argo
4 2 (1.96%) Graylog
4 2 (1.96%) Istio
4 2 (1.96%) Single Sign-On
Vendors
1 16 (15.69%) IBM
2 12 (11.76%) Google
3 11 (10.78%) Microsoft
4 8 (7.84%) SAP
5 6 (5.88%) Apple
6 5 (4.90%) Oracle
7 4 (3.92%) F5
8 2 (1.96%) Dynatrace
8 2 (1.96%) Splunk
9 1 (0.98%) SnapLogic