Security Analyst Jobs in the City of London

Security Analyst
Central London > City of London

The median Security Analyst salary in the City of London is £65,000 per year, according to job vacancies posted during the 6 months leading to 17 June 2024.

The table below provides salary benchmarking and summary statistics, comparing them to the same period in the previous two years.

6 months to
17 Jun 2024
Same period 2023 Same period 2022
Rank 119 187 241
Rank change year-on-year +68 +54 -47
Permanent jobs requiring a Security Analyst 59 32 64
As % of all permanent jobs advertised in the City of London 1.75% 0.72% 0.84%
As % of the Job Titles category 1.82% 0.75% 0.88%
Number of salaries quoted 44 28 53
10th Percentile £45,775 £42,444 £46,150
25th Percentile £48,375 £46,500 £51,250
Median annual salary (50th Percentile) £65,000 £51,000 £58,000
Median % change year-on-year +27.45% -12.07% +0.87%
75th Percentile £80,938 £64,125 £67,500
90th Percentile £120,000 £69,125 £77,500
Central London median annual salary £65,000 £51,000 £65,000
% change year-on-year +27.45% -21.54% +8.33%

All Permanent IT Job Vacancies
City of London

For comparison with the information above, the following table provides summary statistics for all permanent IT job vacancies in the City of London. Most job vacancies include a discernible job title that can be normalized. As such, the figures in the second row provide an indication of the number of permanent jobs in our overall sample.

Permanent vacancies in the City of London with a recognized job title 3,233 4,256 7,303
% of permanent jobs with a recognized job title 96.05% 96.29% 95.58%
Number of salaries quoted 2,493 3,534 5,656
10th Percentile £41,250 £42,000 £45,000
25th Percentile £53,750 £55,000 £56,250
Median annual salary (50th Percentile) £73,500 £75,000 £72,500
Median % change year-on-year -2.00% +3.45% -
75th Percentile £95,000 £97,500 £93,750
90th Percentile £112,500 £115,000 £108,750
Central London median annual salary £72,500 £74,744 £72,500
% change year-on-year -3.00% +3.10% +3.57%

Security Analyst
Job Vacancy Trend in the City of London

Job postings that featured Security Analyst in the job title as a proportion of all IT jobs advertised in the City of London.
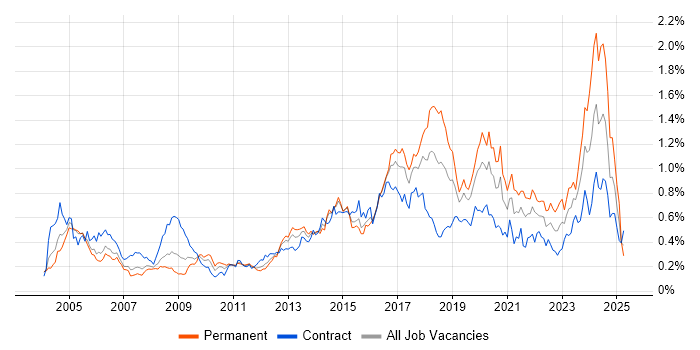
Job vacancy trend for Security Analyst in the City of London

Security Analyst
Salary Trend in the City of London

3-month moving average salary quoted in jobs citing Security Analyst in the City of London.

Salary trend for Security Analyst in the City of London

Security Analyst
Salary Histogram in the City of London

Salary distribution for jobs citing Security Analyst in the City of London over the 6 months to 17 June 2024.

Salary histogram for Security Analyst in the City of London

Security Analyst Skill Set
Top 30 Co-occurring Skills and Capabilities in the City of London

For the 6 months to 17 June 2024, Security Analyst job roles required the following skills and capabilities in order of popularity. The figures indicate the absolute number co-occurrences and as a proportion of all permanent job ads across the City of London region featuring Security Analyst in the job title.

1 35 (59.32%) Information Security
1 35 (59.32%) Cybersecurity
2 30 (50.85%) SIEM
3 28 (47.46%) Incident Response
4 27 (45.76%) Finance
5 26 (44.07%) Firewall
6 22 (37.29%) Incident Management
6 22 (37.29%) CISSP
7 20 (33.90%) Microsoft
7 20 (33.90%) ISO/IEC 27001
8 19 (32.20%) Application Security
9 18 (30.51%) Vulnerability Management
10 15 (25.42%) Security Operations
10 15 (25.42%) Microsoft 365
11 14 (23.73%) Threat and Vulnerability Management
12 13 (22.03%) GRC
12 13 (22.03%) Privileged Access Management
12 13 (22.03%) Threat Detection
12 13 (22.03%) Analytical Skills
12 13 (22.03%) Change Management
12 13 (22.03%) Security Management
13 12 (20.34%) NIST
13 12 (20.34%) Social Skills
14 11 (18.64%) MITRE ATT&CK
15 10 (16.95%) Problem-Solving
15 10 (16.95%) CISA
15 10 (16.95%) Risk Management
16 9 (15.25%) Degree
16 9 (15.25%) REST
16 9 (15.25%) DevSecOps

Security Analyst Skill Set
Co-occurring Skills and Capabilities in the City of London by Category

The follow tables expand on the table above by listing co-occurrences grouped by category. The same employment type, locality and period is covered with up to 20 co-occurrences shown in each of the following categories:

Cloud Services
1 15 (25.42%) Microsoft 365
2 2 (3.39%) AWS
2 2 (3.39%) Azure
Communications & Networking
1 26 (44.07%) Firewall
2 5 (8.47%) Intrusion Detection
2 5 (8.47%) IPsec
2 5 (8.47%) SSL
2 5 (8.47%) TCP/IP
3 2 (3.39%) VLAN
3 2 (3.39%) Wi-Fi
4 1 (1.69%) Network Security
Development Applications
1 8 (13.56%) Burp Suite
1 8 (13.56%) Metasploit
General
1 27 (45.76%) Finance
2 13 (22.03%) Analytical Skills
3 12 (20.34%) Social Skills
4 8 (13.56%) Legal
5 5 (8.47%) Organisational Skills
6 3 (5.08%) Financial Institution
7 2 (3.39%) Retail
8 1 (1.69%) Banking
8 1 (1.69%) Law
8 1 (1.69%) Marketing
Libraries, Frameworks & Software Standards
1 9 (15.25%) REST
2 2 (3.39%) SailPoint
Miscellaneous
1 5 (8.47%) Cyber Threat
1 5 (8.47%) Onboarding
1 5 (8.47%) Security Posture
1 5 (8.47%) Self-Motivation
2 4 (6.78%) Management Information System
3 3 (5.08%) Cyber Defence
3 3 (5.08%) Cyber Kill Chain
3 3 (5.08%) Cyberattack
3 3 (5.08%) Insider Threat
4 2 (3.39%) Security Operations Centre
5 1 (1.69%) e-Learning
5 1 (1.69%) Social Media
Operating Systems
1 2 (3.39%) Linux
2 1 (1.69%) Mac OS X
2 1 (1.69%) Windows
Processes & Methodologies
1 35 (59.32%) Cybersecurity
1 35 (59.32%) Information Security
2 30 (50.85%) SIEM
3 28 (47.46%) Incident Response
4 22 (37.29%) Incident Management
5 19 (32.20%) Application Security
6 18 (30.51%) Vulnerability Management
7 15 (25.42%) Security Operations
8 14 (23.73%) Threat and Vulnerability Management
9 13 (22.03%) Change Management
9 13 (22.03%) Privileged Access Management
9 13 (22.03%) Security Management
9 13 (22.03%) Threat Detection
10 11 (18.64%) MITRE ATT&CK
11 10 (16.95%) Problem-Solving
11 10 (16.95%) Risk Management
12 9 (15.25%) DevSecOps
13 8 (13.56%) Visualisation
13 8 (13.56%) Vulnerability Assessment
14 7 (11.86%) OWASP
Programming Languages
1 3 (5.08%) PowerShell
1 3 (5.08%) Python
Qualifications
1 22 (37.29%) CISSP
2 10 (16.95%) CISA
3 9 (15.25%) Degree
4 5 (8.47%) CISM
4 5 (8.47%) CompTIA CySA+
4 5 (8.47%) CompTIA Security+
4 5 (8.47%) GIAC
4 5 (8.47%) MCSA
4 5 (8.47%) Microsoft Certification
5 2 (3.39%) CEH
5 2 (3.39%) Computer Science Degree
5 2 (3.39%) ISACA
5 2 (3.39%) ISO 27001 Lead Auditor
5 2 (3.39%) Security Cleared
6 1 (1.69%) CRISC
6 1 (1.69%) Master's Degree
Quality Assurance & Compliance
1 20 (33.90%) ISO/IEC 27001
2 13 (22.03%) GRC
3 12 (20.34%) NIST
4 8 (13.56%) NCSC
5 2 (3.39%) Cyber Essentials
6 1 (1.69%) California Consumer Privacy Act
6 1 (1.69%) GDPR
6 1 (1.69%) HIPAA
6 1 (1.69%) SOC 2
Systems Management
1 8 (13.56%) Nmap
2 1 (1.69%) CSIRT
Vendors
1 20 (33.90%) Microsoft
2 3 (5.08%) Intel
3 2 (3.39%) Splunk
4 1 (1.69%) CrowdStrike
4 1 (1.69%) Meraki
4 1 (1.69%) Okta
4 1 (1.69%) Rapid7