SQL Job Trends in Middlesex

SQL (Structured Query Language)
South East > Middlesex

The table below provides summary statistics and salary benchmarking for jobs advertised in Middlesex requiring SQL skills. It covers permanent job vacancies from the 6 months leading up to 16 October 2026, with comparisons to the same periods in the previous two years.

6 months to
16 Oct 2026
Same period 2025 Same period 2024
Rank 11 18 15
Rank change year-on-year +7 -3 -
Permanent jobs citing SQL 11 19 4
As % of all permanent jobs in Middlesex 18.64% 13.01% 7.14%
As % of the Programming Languages category 55.00% 54.29% 17.39%
Number of salaries quoted 5 5 0
10th Percentile £44,550 - -
25th Percentile £56,250 £33,750 -
Median annual salary (50th Percentile) £57,500 £37,500 -
Median % change year-on-year +53.33% - -
75th Percentile £65,000 £41,250 -
90th Percentile - - -
South East median annual salary £55,000 £46,000 £50,000
% change year-on-year +19.57% -8.00% -4.76%

All Programming Languages
Middlesex

SQL falls under the Programming Languages category. For comparison with the information above, the following table provides summary statistics for all permanent job vacancies requiring coding skills in Middlesex.

Permanent vacancies with a requirement for coding skills 20 35 23
As % of all permanent jobs advertised in Middlesex 33.90% 23.97% 41.07%
Number of salaries quoted 5 5 2
10th Percentile £44,550 - £54,000
25th Percentile £56,250 £33,750 £54,375
Median annual salary (50th Percentile) £57,500 £37,500 £60,000
Median % change year-on-year +53.33% -37.50% -31.43%
75th Percentile £65,000 £41,250 £66,875
90th Percentile - - £68,000
South East median annual salary £60,000 £55,000 £56,252
% change year-on-year +9.09% -2.23% -2.17%

SQL
Job Vacancy Trend in Middlesex

Historical trend showing the proportion of permanent IT job postings citing SQL relative to all permanent IT jobs advertised in Middlesex.

SQL job vacancy trend in Middlesex

SQL
Salary Trend in Middlesex

Salary distribution trend for jobs in Middlesex citing SQL.
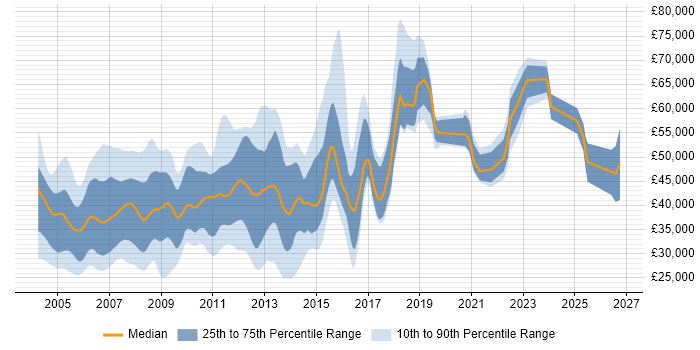
Salary distribution trend for jobs in Middlesex citing SQL

SQL
Salary Histogram in Middlesex

Salary distribution for jobs citing SQL in Middlesex over the 6 months to 16 October 2026.

Salary histogram for SQL in Middlesex

SQL
Co-Occurring Skills & Capabilities in Middlesex by Category

The following tables expand on the one above by listing co-occurrences grouped by category. They cover the same employment type, locality and period, with up to 20 co-occurrences shown in each category:

Applications
1 3 (27.27%) Microsoft Office
2 2 (18.18%) Microsoft Excel
2 2 (18.18%) Microsoft PowerPoint
2 2 (18.18%) Spreadsheet
Cloud Services
1 4 (36.36%) AWS
1 4 (36.36%) dbt
1 4 (36.36%) PaaS
1 4 (36.36%) SaaS
1 4 (36.36%) Snowflake
2 3 (27.27%) Azure
3 2 (18.18%) Power Platform
4 1 (9.09%) Azure DevOps
Communications & Networking
1 2 (18.18%) LAN
1 2 (18.18%) WAN
Database & Business Intelligence
1 2 (18.18%) Power BI
1 2 (18.18%) SQL Server
Development Applications
1 2 (18.18%) Git
General
1 7 (63.64%) Finance
2 6 (54.55%) Inclusion and Diversity
3 3 (27.27%) Social Skills
4 2 (18.18%) Analytical Skills
Job Titles
1 4 (36.36%) Data Engineer
1 4 (36.36%) Principal Data Engineer
1 4 (36.36%) Principal Engineer
2 2 (18.18%) Business Intelligence Developer
2 2 (18.18%) Data Scientist
2 2 (18.18%) Developer
2 2 (18.18%) Power BI Developer
2 2 (18.18%) Principal Data Scientist
2 2 (18.18%) Senior Data Scientist
2 2 (18.18%) Systems Engineer
3 1 (9.09%) Analyst
3 1 (9.09%) Test Analyst
Miscellaneous
1 4 (36.36%) Cloud Native
2 2 (18.18%) Driving Licence
2 2 (18.18%) Enterprise Software
2 2 (18.18%) Industry 4.0
2 2 (18.18%) Operational Technology
2 2 (18.18%) PKI
2 2 (18.18%) Replication
2 2 (18.18%) SCADA
2 2 (18.18%) Self-Motivation
3 1 (9.09%) Client/Server
3 1 (9.09%) Greenfield Project
Operating Systems
1 1 (9.09%) Windows
Processes & Methodologies
1 9 (81.82%) Agile
2 8 (72.73%) Decision-Making
3 6 (54.55%) Continuous Improvement
3 6 (54.55%) Data Engineering
3 6 (54.55%) Data Modelling
3 6 (54.55%) Line Management
4 5 (45.45%) CI/CD
4 5 (45.45%) DevOps
4 5 (45.45%) Problem-Solving
5 4 (36.36%) AI
5 4 (36.36%) Computer Science
5 4 (36.36%) Data Ingestion
5 4 (36.36%) Data Management
5 4 (36.36%) Data Pipeline
5 4 (36.36%) Enterprise Data Management
5 4 (36.36%) Incident Response
5 4 (36.36%) Information Security
5 4 (36.36%) Performance Optimisation
5 4 (36.36%) Root Cause Analysis
5 4 (36.36%) Test Automation
Programming Languages
1 2 (18.18%) Data Analysis Expressions
1 2 (18.18%) PowerShell
1 2 (18.18%) Python
Qualifications
1 6 (54.55%) Degree
2 2 (18.18%) Azure Certification
2 2 (18.18%) CTC Cleared
2 2 (18.18%) HNC
2 2 (18.18%) MCSA
2 2 (18.18%) Microsoft Certification
2 2 (18.18%) Numerate Degree
2 2 (18.18%) SC Cleared
2 2 (18.18%) Security Cleared
3 1 (9.09%) ISEB
3 1 (9.09%) ISTQB
Quality Assurance & Compliance
1 3 (27.27%) QA
2 2 (18.18%) Actionable Recommendations
3 1 (9.09%) Software Quality Assurance
System Software
1 2 (18.18%) Active Directory
2 1 (9.09%) Virtual Machines
Systems Management
1 2 (18.18%) SCCM
1 2 (18.18%) Symantec Endpoint Protection
Vendors
1 5 (45.45%) Microsoft
2 2 (18.18%) CA Agile Central
2 2 (18.18%) Dell
2 2 (18.18%) Symantec
2 2 (18.18%) Veeam
2 2 (18.18%) VMware