Senior
South East > Middlesex
As of 28 May 2025, there is not enough information available from job vacancies posted within the last 6 months to determine the median Senior salary in Middlesex.
| 6 months to 28 May 2025 |
Same period 2024 | Same period 2023 | |
|---|---|---|---|
| Rank | 10 | 12 | 25 |
| Rank change year-on-year | +2 | +13 | -10 |
| Permanent jobs requiring a Senior | 76 | 50 | 6 |
| As % of all permanent jobs advertised in Middlesex | 24.52% | 21.74% | 4.96% |
| As % of the Job Titles category | 26.95% | 22.12% | 4.96% |
| Number of salaries quoted | 0 | 11 | 6 |
| 10th Percentile | - | - | - |
| 25th Percentile | - | £55,000 | £76,250 |
| Median annual salary (50th Percentile) | - | £61,339 | £77,500 |
| Median % change year-on-year | - | -20.85% | +39.64% |
| 75th Percentile | - | £90,000 | £78,750 |
| 90th Percentile | - | £100,000 | - |
| South East median annual salary | £62,000 | £60,000 | £67,500 |
| % change year-on-year | +3.33% | -11.11% | +3.85% |
All Permanent IT Job Vacancies
Middlesex
For comparison with the information above, the following table provides summary statistics for all permanent IT job vacancies in Middlesex. Most job vacancies include a discernible job title that can be normalized. As such, the figures in the second row provide an indication of the number of permanent jobs in our overall sample.
| Permanent vacancies in Middlesex with a recognized job title | 282 | 226 | 121 |
| % of permanent jobs with a recognized job title | 90.97% | 98.26% | 100.00% |
| Number of salaries quoted | 9 | 71 | 107 |
| 10th Percentile | - | £30,050 | £52,500 |
| 25th Percentile | £57,500 | £37,794 | £69,375 |
| Median annual salary (50th Percentile) | £62,500 | £44,658 | £85,000 |
| Median % change year-on-year | +39.95% | -47.46% | +70.00% |
| 75th Percentile | £66,250 | £65,000 | £97,500 |
| 90th Percentile | £71,000 | £83,750 | £107,500 |
| South East median annual salary | £55,000 | £50,000 | £55,000 |
| % change year-on-year | +10.00% | -9.09% | - |
Senior
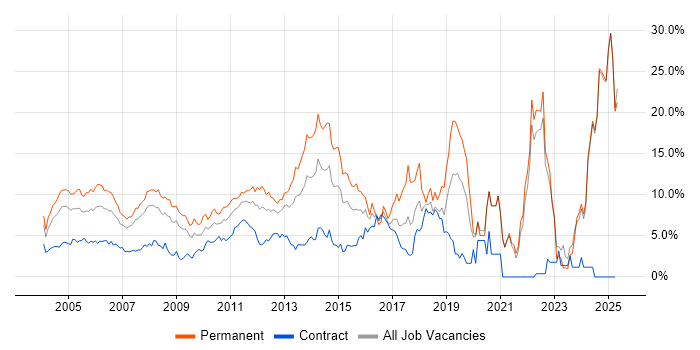
Job Vacancy Trend in Middlesex
Job postings that featured Senior in the job title as a proportion of all IT jobs advertised in Middlesex.

Senior
Salary Trend in Middlesex
3-month moving average salary quoted in jobs citing Senior in Middlesex.
Senior Skill Set
Top 30 Co-occurring Skills and Capabilities in Middlesex
For the 6 months to 28 May 2025, Senior job roles required the following skills and capabilities in order of popularity. The figures indicate the absolute number co-occurrences and as a proportion of all permanent job ads across the Middlesex region featuring Senior in the job title.
|
|
Senior Skill Set
Co-occurring Skills and Capabilities in Middlesex by Category
The follow tables expand on the table above by listing co-occurrences grouped by category. The same employment type, locality and period is covered with up to 20 co-occurrences shown in each of the following categories:
|
|
|||||||||||||||||||||||||||||||||||||||||||||||||||||||||||||||||||||||||||||||||||||||||||||||||||||||||||||||||||||
|
|
|||||||||||||||||||||||||||||||||||||||||||||||||||||||||||||||||||||||||||||||||||||||||||||||||||||||||||||||||||||
|
|
|||||||||||||||||||||||||||||||||||||||||||||||||||||||||||||||||||||||||||||||||||||||||||||||||||||||||||||||||||||
|
|
|||||||||||||||||||||||||||||||||||||||||||||||||||||||||||||||||||||||||||||||||||||||||||||||||||||||||||||||||||||
|
|
|||||||||||||||||||||||||||||||||||||||||||||||||||||||||||||||||||||||||||||||||||||||||||||||||||||||||||||||||||||
|
|
|||||||||||||||||||||||||||||||||||||||||||||||||||||||||||||||||||||||||||||||||||||||||||||||||||||||||||||||||||||
|
|
|||||||||||||||||||||||||||||||||||||||||||||||||||||||||||||||||||||||||||||||||||||||||||||||||||||||||||||||||||||
|
|
|||||||||||||||||||||||||||||||||||||||||||||||||||||||||||||||||||||||||||||||||||||||||||||||||||||||||||||||||||||
|
|
|||||||||||||||||||||||||||||||||||||||||||||||||||||||||||||||||||||||||||||||||||||||||||||||||||||||||||||||||||||
