.NET Jobs in Reading

Microsoft .NET (dotNet)
Berkshire > Reading

The following table provides summary statistics for permanent job vacancies advertised in Reading with a requirement for .NET skills. Included is a benchmarking guide to the salaries offered in vacancies that have cited .NET over the 6 months to 27 April 2024 with a comparison to the same period in the previous 2 years.

6 months to
27 Apr 2024
Same period 2023 Same period 2022
Rank 30 24 13
Rank change year-on-year -6 -11 -2
Permanent jobs citing .NET 109 159 240
As % of all permanent jobs advertised in Reading 6.38% 9.83% 13.78%
As % of the Libraries, Frameworks & Software Standards category 29.95% 31.99% 38.46%
Number of salaries quoted 66 106 111
10th Percentile £45,000 £40,000 £37,500
25th Percentile £47,500 £52,500 £47,188
Median annual salary (50th Percentile) £61,500 £62,500 £62,500
Median % change year-on-year -1.60% - +13.64%
75th Percentile £68,750 £92,500 £71,250
90th Percentile £75,000 £112,500 £80,000
Berkshire median annual salary £75,000 £65,000 £62,500
% change year-on-year +15.38% +4.00% +13.64%

All Software Libraries and Frameworks
Reading

.NET is in the Software Libraries and Frameworks category. The following table is for comparison with the above and provides summary statistics for all permanent job vacancies advertised in Reading with a requirement for technical specification, industry standards, software libraries and framework skills.

Permanent vacancies with a requirement for technical specification, industry standards, software libraries and framework skills 364 497 624
As % of all permanent jobs advertised in Reading 21.30% 30.74% 35.82%
Number of salaries quoted 199 316 359
10th Percentile £39,500 £40,000 £37,500
25th Percentile £47,500 £52,500 £47,500
Median annual salary (50th Percentile) £60,000 £70,000 £62,500
Median % change year-on-year -14.29% +12.00% +4.17%
75th Percentile £72,500 £89,063 £75,000
90th Percentile £84,000 £105,000 £85,000
Berkshire median annual salary £65,000 £65,000 £60,500
% change year-on-year - +7.44% +5.22%

.NET
Job Vacancy Trend in Reading

Job postings citing .NET as a proportion of all IT jobs advertised in Reading.
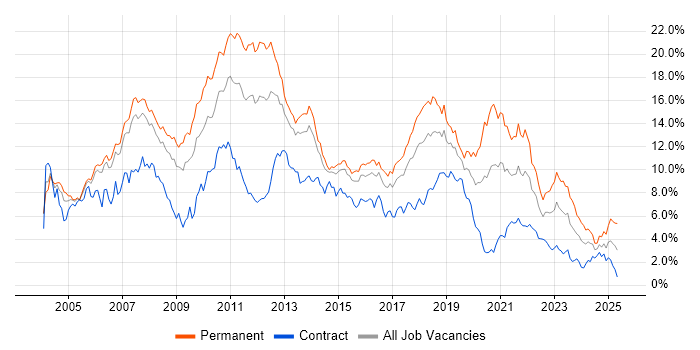
Job vacancy trend for .NET in Reading

.NET
Salary Trend in Reading

3-month moving average salary quoted in jobs citing .NET in Reading.

Salary trend for .NET in Reading

.NET
Salary Histogram in Reading

Salary distribution for jobs citing .NET in Reading over the 6 months to 27 April 2024.

Salary histogram for .NET in Reading

.NET
Co-occurring Skills and Capabilities in Reading by Category

The follow tables expand on the table above by listing co-occurrences grouped by category. The same employment type, locality and period is covered with up to 20 co-occurrences shown in each of the following categories:

Application Platforms
1 25 (22.94%) ArcGIS
1 25 (22.94%) GeoServer
2 11 (10.09%) CMS
3 7 (6.42%) Kentico
3 7 (6.42%) SharePoint
4 6 (5.50%) Headless CMS
4 6 (5.50%) IIS
4 6 (5.50%) Sitecore CMS
4 6 (5.50%) Umbraco
5 3 (2.75%) Alfresco
5 3 (2.75%) Documentum
5 3 (2.75%) FileNet
6 2 (1.83%) Confluence
7 1 (0.92%) Apache
7 1 (0.92%) Apache Spark
Cloud Services
1 77 (70.64%) Azure
2 38 (34.86%) AWS
3 15 (13.76%) Azure DevOps
4 8 (7.34%) Microsoft 365
5 7 (6.42%) Kontent
6 5 (4.59%) Power Platform
7 4 (3.67%) SaaS
7 4 (3.67%) TestFlight
8 3 (2.75%) Dropbox
8 3 (2.75%) Microsoft Purview
8 3 (2.75%) OneDrive
9 2 (1.83%) PowerApps
10 1 (0.92%) Azure Data Factory
10 1 (0.92%) Azure Functions
10 1 (0.92%) Basecamp
10 1 (0.92%) Cloud Computing
10 1 (0.92%) Dynamics 365
10 1 (0.92%) PaaS
10 1 (0.92%) Power Automate
10 1 (0.92%) Serverless
Communications & Networking
1 7 (6.42%) Internet
2 1 (0.92%) DNS
2 1 (0.92%) Firewall
Database & Business Intelligence
1 25 (22.94%) GIS
1 25 (22.94%) PostgreSQL
1 25 (22.94%) QGIS
1 25 (22.94%) SQL Server
2 5 (4.59%) Azure SQL Database
2 5 (4.59%) Data Warehouse
3 3 (2.75%) Relational Database
4 1 (0.92%) Elasticsearch
4 1 (0.92%) MySQL
4 1 (0.92%) SQL Server Analysis Services
4 1 (0.92%) SQL Server Integration Services
Development Applications
1 10 (9.17%) Visual Studio
2 7 (6.42%) JIRA
3 6 (5.50%) Git
3 6 (5.50%) Jenkins
4 4 (3.67%) Subversion
5 1 (0.92%) Visual Studio Code
General
1 20 (18.35%) Social Skills
2 11 (10.09%) Back Office
3 10 (9.17%) Health Technology
3 10 (9.17%) Tech for Good
4 9 (8.26%) Analytical Skills
4 9 (8.26%) Finance
5 7 (6.42%) Police
5 7 (6.42%) Retail
6 5 (4.59%) Aerospace
7 4 (3.67%) Banking
7 4 (3.67%) Documentation Skills
8 3 (2.75%) Legal
9 2 (1.83%) Manufacturing
9 2 (1.83%) Marketing
10 1 (0.92%) Law
10 1 (0.92%) Organisational Skills
Job Titles
1 49 (44.95%) Senior
1 49 (44.95%) Software Engineer
2 47 (43.12%) Developer
3 25 (22.94%) Senior Software Engineer
4 22 (20.18%) C# Developer
5 21 (19.27%) .NET Developer
5 21 (19.27%) Senior Developer
6 17 (15.60%) C# .NET Developer
7 14 (12.84%) Senior C# Developer
8 12 (11.01%) Software Developer
9 11 (10.09%) Senior .NET Developer
10 10 (9.17%) .NET Applications Developer
10 10 (9.17%) Applications Developer
10 10 (9.17%) CMS Developer
11 9 (8.26%) Senior C# .NET Developer
12 8 (7.34%) C# Application Developer
12 8 (7.34%) C# ASP.NET Developer
12 8 (7.34%) Senior .NET Applications Developer
12 8 (7.34%) Senior C# Application Developer
12 8 (7.34%) Senior C# ASP.NET Developer
Libraries, Frameworks & Software Standards
1 53 (48.62%) React
2 47 (43.12%) .NET Core
3 46 (42.20%) CSS
4 33 (30.28%) ASP.NET
5 25 (22.94%) Leaflet
5 25 (22.94%) OpenLayers
5 25 (22.94%) PostGIS
6 17 (15.60%) Blazor
7 16 (14.68%) AngularJS
8 14 (12.84%) HTML
9 11 (10.09%) ASP.NET MVC
9 11 (10.09%) Web Services
10 8 (7.34%) CSS3
10 8 (7.34%) HTML5
10 8 (7.34%) RESTful
10 8 (7.34%) Vue
11 6 (5.50%) .NET Framework
11 6 (5.50%) Next.js
12 5 (4.59%) Entity Framework
12 5 (4.59%) jQuery
Miscellaneous
1 10 (9.17%) Self-Motivation
2 7 (6.42%) Greenfield Project
3 4 (3.67%) Legacy Systems
3 4 (3.67%) Management Information System
3 4 (3.67%) Mobile Banking
3 4 (3.67%) Replication
4 1 (0.92%) Distributed Systems
4 1 (0.92%) Enterprise Cloud
4 1 (0.92%) Product Ownership
4 1 (0.92%) Virtual Team
Operating Systems
1 4 (3.67%) Android
1 4 (3.67%) Apple iOS
1 4 (3.67%) Windows
2 2 (1.83%) Linux
Processes & Methodologies
1 55 (50.46%) Software Engineering
2 47 (43.12%) Agile
3 45 (41.28%) DevOps
4 35 (32.11%) Actionable Insight
5 33 (30.28%) Web Development
6 25 (22.94%) Full Stack Development
7 17 (15.60%) Problem-Solving
8 14 (12.84%) CRM
9 12 (11.01%) MVC
9 12 (11.01%) Test Automation
10 11 (10.09%) Deployment Automation
10 11 (10.09%) Presales
11 10 (9.17%) Mentoring
12 9 (8.26%) CI/CD
12 9 (8.26%) Collaborative Working
12 9 (8.26%) Technical Leadership
13 7 (6.42%) Data Privacy
13 7 (6.42%) E-business
13 7 (6.42%) Progressive Web App
13 7 (6.42%) Project Delivery
Programming Languages
1 77 (70.64%) C#
2 45 (41.28%) JavaScript
3 33 (30.28%) SQL
4 25 (22.94%) Python
5 13 (11.93%) Java
5 13 (11.93%) TypeScript
6 12 (11.01%) T-SQL
7 6 (5.50%) PowerShell
8 5 (4.59%) C
8 5 (4.59%) C++
9 4 (3.67%) Objective-C
9 4 (3.67%) Swift
9 4 (3.67%) VB.NET
9 4 (3.67%) VBScript
Qualifications
1 37 (33.94%) Security Cleared
2 35 (32.11%) SC Cleared
3 11 (10.09%) Degree
4 8 (7.34%) DBS Check
5 2 (1.83%) Azure Certification
6 1 (0.92%) Computer Science Degree
6 1 (0.92%) Microsoft Certification
Quality Assurance & Compliance
1 7 (6.42%) QA
System Software
1 5 (4.59%) Virtual Machines
2 3 (2.75%) Docker
Systems Management
1 5 (4.59%) Ansible
2 4 (3.67%) Kubernetes
3 1 (0.92%) Kibana
Vendors
1 29 (26.61%) Microsoft
2 25 (22.94%) ESRI
3 6 (5.50%) Optimizely
3 6 (5.50%) Sitecore
4 3 (2.75%) EMC
4 3 (2.75%) Hyland
4 3 (2.75%) IBM
4 3 (2.75%) iManage
4 3 (2.75%) Laserfiche
4 3 (2.75%) OpenText
4 3 (2.75%) Oracle
4 3 (2.75%) Salesforce
5 2 (1.83%) Atlassian
6 1 (0.92%) Databricks