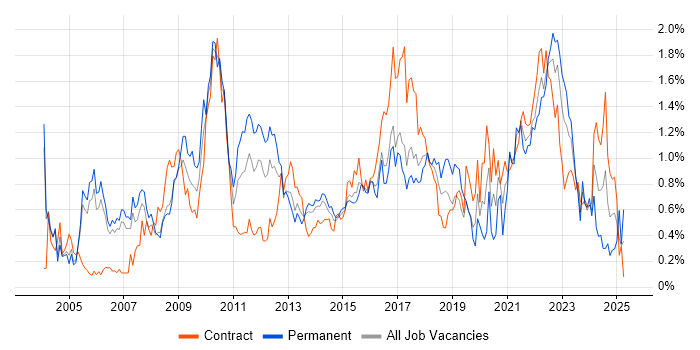
Adobe Contracts in Reading

Adobe
Berkshire > Reading

The table below provides summary statistics for contract job vacancies advertised in Reading with a requirement for knowledge and experience of Adobe products and/or services. Included is a benchmarking guide to the contractor rates offered in vacancies that have cited Adobe over the 6 months to 23 April 2024 with a comparison to the same period in the previous 2 years.

The figures below represent the IT contractor job market in general and are not representative of contractor rates within Adobe Systems, Inc.

6 months to
23 Apr 2024
Same period 2023 Same period 2022
Rank 92 76 84
Rank change year-on-year -16 +8 -25
Contract jobs citing Adobe 8 8 17
As % of all contract jobs advertised in Reading 0.67% 0.76% 1.26%
As % of the Vendors category 1.38% 1.50% 2.94%
Number of daily rates quoted 5 4 13
10th Percentile £188 £408 -
25th Percentile - £438 £130
Median daily rate (50th Percentile) £200 £481 £300
Median % change year-on-year -58.40% +60.26% -29.41%
75th Percentile £425 £564 £425
90th Percentile £470 £645 £528
Berkshire median daily rate £300 £481 £325
% change year-on-year -37.60% +47.93% -12.29%

All Vendors
Reading

Adobe is in the Vendor Products and Services category. The following table is for comparison with the above and provides summary statistics for all contract job vacancies with a requirement for knowledge or experience of vendor products and services advertised in Reading.

Contract vacancies with a requirement for knowledge or experience of vendor products and services 581 533 578
As % of all contract IT jobs advertised in Reading 48.82% 50.62% 42.94%
Number of daily rates quoted 364 367 414
10th Percentile £213 £387 £184
25th Percentile £412 £497 £381
Median daily rate (50th Percentile) £550 £586 £515
Median % change year-on-year -6.14% +13.79% +4.46%
75th Percentile £638 £685 £615
90th Percentile £688 £725 £667
Berkshire median daily rate £513 £550 £500
% change year-on-year -6.82% +10.00% +4.17%
Number of hourly rates quoted 24 16 5
10th Percentile £29.49 £18.11 £26.30
25th Percentile £52.90 £46.88 £27.50
Median hourly rate £58.30 £59.84 £30.00
Median % change year-on-year -2.57% +99.46% -51.22%
75th Percentile £61.82 £66.21 £35.00
90th Percentile £64.49 £72.88 £45.50
Berkshire median hourly rate £58.30 £56.88 £50.00
% change year-on-year +2.51% +13.75% +117.39%

Adobe
Job Vacancy Trend in Reading

Job postings citing Adobe as a proportion of all IT jobs advertised in Reading.

Job vacancy trend for Adobe in Reading

Adobe
Contractor Daily Rate Trend in Reading

3-month moving average daily rate quoted in jobs citing Adobe in Reading.

Daily rate trend for Adobe in Reading

Adobe
Daily Rate Histogram in Reading

Daily rate distribution for jobs citing Adobe in Reading over the 6 months to 23 April 2024.

Daily rate histogram for Adobe in Reading

Adobe
Contractor Hourly Rate Trend in Reading

3-month moving average hourly rates quoted in jobs citing Adobe in Reading.

Hourly rate trend for Adobe in Reading

Adobe
Co-occurring Skills and Capabilities in Reading by Category

The follow tables expand on the table above by listing co-occurrences grouped by category. The same employment type, locality and period is covered with up to 20 co-occurrences shown in each of the following categories:

Application Platforms
1 2 (25.00%) Adobe Experience Manager
2 1 (12.50%) Moodle
Applications
1 3 (37.50%) InDesign
1 3 (37.50%) Photoshop
2 2 (25.00%) Adobe Creative Suite
2 2 (25.00%) Adobe Illustrator
3 1 (12.50%) 3ds Max
3 1 (12.50%) Blender
3 1 (12.50%) Microsoft Office
3 1 (12.50%) Microsoft PowerPoint
Cloud Services
1 2 (25.00%) Adobe Creative Cloud
2 1 (12.50%) Azure
2 1 (12.50%) Azure DevOps
2 1 (12.50%) Figma
2 1 (12.50%) npm
Development Applications
1 2 (25.00%) JIRA
2 1 (12.50%) rollup.js
2 1 (12.50%) Visual Studio
2 1 (12.50%) webpack
General
1 3 (37.50%) Marketing
1 3 (37.50%) Social Skills
2 1 (12.50%) Advertising
2 1 (12.50%) Public Sector
2 1 (12.50%) Telecoms
Job Titles
1 3 (37.50%) Designer
1 3 (37.50%) Developer
2 2 (25.00%) Analyst
2 2 (25.00%) Digital Designer
2 2 (25.00%) QA Analyst
3 1 (12.50%) Digital Analyst
3 1 (12.50%) Telecoms Analyst
3 1 (12.50%) UI Developer
Libraries, Frameworks & Software Standards
1 2 (25.00%) HTML
2 1 (12.50%) CSS
2 1 (12.50%) Enzyme
2 1 (12.50%) Jest
2 1 (12.50%) Next.js
2 1 (12.50%) React
2 1 (12.50%) Redux
2 1 (12.50%) Sass
Miscellaneous
1 2 (25.00%) Animation
1 2 (25.00%) Graphic Design
1 2 (25.00%) Product Ownership
1 2 (25.00%) Social Media
2 1 (12.50%) Digital Media
2 1 (12.50%) W3C
Processes & Methodologies
1 2 (25.00%) Acceptance Criteria
1 2 (25.00%) Agile
1 2 (25.00%) Scrum
1 2 (25.00%) Test Automation
1 2 (25.00%) Typography
1 2 (25.00%) User Experience
1 2 (25.00%) Wireframes
2 1 (12.50%) 3D Modelling
2 1 (12.50%) API Testing
2 1 (12.50%) Black-Box Testing
2 1 (12.50%) Break/Fix
2 1 (12.50%) Creative Thinking
2 1 (12.50%) Deadline-Driven
2 1 (12.50%) DevOps
2 1 (12.50%) Infrastructure as Code
2 1 (12.50%) SDLC
2 1 (12.50%) SOLID
2 1 (12.50%) UX Design
2 1 (12.50%) V-Model
2 1 (12.50%) Waterfall
Programming Languages
1 2 (25.00%) Java
Qualifications
1 1 (12.50%) Degree
1 1 (12.50%) ISTQB
1 1 (12.50%) ISTQB Foundation Certification
1 1 (12.50%) Security Cleared
Quality Assurance & Compliance
1 3 (37.50%) Accessibility
2 2 (25.00%) QA