Containerization
Berkshire > Reading
The table below provides summary statistics and contractor rates for jobs advertised in Reading requiring Containerisation skills. It covers vacancies from the 6 months leading up to 27 September 2025, with comparisons to the same periods in the previous two years.
| 6 months to 27 Sep 2025 |
Same period 2024 | Same period 2023 | |
|---|---|---|---|
| Rank | 47 | 71 | 73 |
| Rank change year-on-year | +24 | +2 | +16 |
| Contract jobs citing Containerisation | 18 | 18 | 17 |
| As % of all contract jobs advertised in Reading | 3.02% | 1.63% | 1.53% |
| As % of the Processes & Methodologies category | 3.29% | 1.89% | 1.73% |
| Number of daily rates quoted | 9 | 8 | 17 |
| 10th Percentile | £355 | £400 | £588 |
| 25th Percentile | £400 | £494 | £613 |
| Median daily rate (50th Percentile) | £450 | £625 | £650 |
| Median % change year-on-year | -28.00% | -3.85% | +19.82% |
| 75th Percentile | £500 | £659 | £688 |
| 90th Percentile | £593 | £688 | £693 |
| Berkshire median daily rate | £500 | £482 | £650 |
| % change year-on-year | +3.79% | -25.85% | +10.64% |
All Process and Methodology Skills
Reading
Containerisation falls under the Processes and Methodologies category. For comparison with the information above, the following table provides summary statistics for all contract job vacancies requiring process or methodology skills in Reading.
| Contract vacancies with a requirement for process or methodology skills | 547 | 953 | 985 |
| As % of all contract IT jobs advertised in Reading | 91.78% | 86.40% | 88.74% |
| Number of daily rates quoted | 344 | 513 | 653 |
| 10th Percentile | £343 | £350 | £300 |
| 25th Percentile | £450 | £475 | £425 |
| Median daily rate (50th Percentile) | £525 | £580 | £550 |
| Median % change year-on-year | -9.48% | +5.45% | +9.56% |
| 75th Percentile | £609 | £650 | £638 |
| 90th Percentile | £650 | £700 | £700 |
| Berkshire median daily rate | £500 | £550 | £525 |
| % change year-on-year | -9.09% | +4.76% | +5.00% |
| Number of hourly rates quoted | 23 | 26 | 18 |
| 10th Percentile | - | £14.50 | £38.80 |
| 25th Percentile | £14.75 | £50.81 | £57.81 |
| Median hourly rate | £28.50 | £61.33 | £66.00 |
| Median % change year-on-year | -53.53% | -7.08% | +24.53% |
| 75th Percentile | £58.00 | £73.57 | £74.59 |
| 90th Percentile | £66.60 | £87.46 | £75.77 |
| Berkshire median hourly rate | £37.28 | £61.55 | £60.00 |
| % change year-on-year | -39.43% | +2.58% | +18.81% |
Containerisation
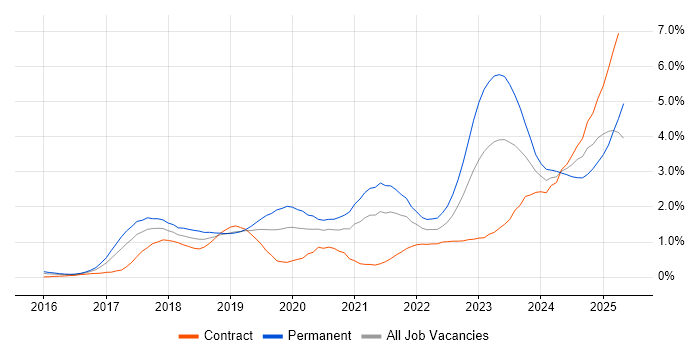
Job Vacancy Trend in Reading
Job postings citing Containerisation as a proportion of all IT jobs advertised in Reading.

Containerisation
Daily Rate Trend in Reading
Contractor daily rate distribution trend for jobs in Reading citing Containerisation.

Containerisation
Daily Rate Histogram in Reading
Daily rate distribution for jobs citing Containerisation in Reading over the 6 months to 27 September 2025.
Containerisation
Co-occurring Skills and Capabilities in Reading by Category
The follow tables expand on the table above by listing co-occurrences grouped by category. The same employment type, locality and period is covered with up to 20 co-occurrences shown in each of the following categories:
|
|
|||||||||||||||||||||||||||||||||||||||||||||||||||||||||||||||||||||||||||||||||||||||||||||
|
|
|||||||||||||||||||||||||||||||||||||||||||||||||||||||||||||||||||||||||||||||||||||||||||||
|
|
|||||||||||||||||||||||||||||||||||||||||||||||||||||||||||||||||||||||||||||||||||||||||||||
|
|
|||||||||||||||||||||||||||||||||||||||||||||||||||||||||||||||||||||||||||||||||||||||||||||
|
|
|||||||||||||||||||||||||||||||||||||||||||||||||||||||||||||||||||||||||||||||||||||||||||||
|
|
|||||||||||||||||||||||||||||||||||||||||||||||||||||||||||||||||||||||||||||||||||||||||||||
|
|
|||||||||||||||||||||||||||||||||||||||||||||||||||||||||||||||||||||||||||||||||||||||||||||
|
|
|||||||||||||||||||||||||||||||||||||||||||||||||||||||||||||||||||||||||||||||||||||||||||||
|
|
|||||||||||||||||||||||||||||||||||||||||||||||||||||||||||||||||||||||||||||||||||||||||||||
