Security Cleared Contracts in the Thames Valley

Security Clearance
South East > Thames Valley

The following table provides summary statistics for contract job vacancies advertised in the Thames Valley with a requirement for Security Cleared qualifications. Included is a benchmarking guide to the contractor rates offered over the 6 months to 1 June 2024 with a comparison to the same period in the previous 2 years.

6 months to
1 Jun 2024
Same period 2023 Same period 2022
Rank 1 2 5
Rank change year-on-year +1 +3 +11
Contract jobs citing Security Cleared 741 669 529
As % of all contract jobs advertised in the Thames Valley 28.06% 23.36% 14.76%
As % of the Qualifications category 69.38% 67.99% 49.26%
Number of daily rates quoted 435 451 422
10th Percentile £250 £335 £360
25th Percentile £435 £415 £449
Median daily rate (50th Percentile) £563 £510 £510
Median % change year-on-year +10.29% - +3.45%
75th Percentile £638 £600 £625
90th Percentile £716 £680 £650
South East median daily rate £600 £525 £538
% change year-on-year +14.29% -2.33% +13.16%
Number of hourly rates quoted 87 40 18
10th Percentile £42.00 £18.05 £16.25
25th Percentile £55.02 £26.77 £17.00
Median hourly rate £61.60 £64.68 £21.03
Median % change year-on-year -4.75% +207.61% -0.12%
75th Percentile £85.65 £74.84 £48.75
90th Percentile £91.52 £79.19 £58.75
South East median hourly rate £61.70 £63.50 £47.50
% change year-on-year -2.84% +33.68% +18.75%

All Academic and Professional Certifications
Thames Valley

Security Cleared is in the Academic Qualifications and Professional Certifications category. The following table is for comparison with the above and provides summary statistics for all contract job vacancies advertised in the Thames Valley with a requirement for academic qualifications or professional certifications.

Contract vacancies requiring academic qualifications or professional certifications 1,068 984 1,074
As % of all contract IT jobs advertised in the Thames Valley 40.44% 34.36% 29.96%
Number of daily rates quoted 561 635 737
10th Percentile £250 £323 £275
25th Percentile £425 £412 £408
Median daily rate (50th Percentile) £525 £505 £480
Median % change year-on-year +3.96% +5.21% +1.05%
75th Percentile £619 £600 £588
90th Percentile £688 £680 £650
South East median daily rate £550 £525 £500
% change year-on-year +4.76% +5.00% +5.26%
Number of hourly rates quoted 110 51 27
10th Percentile £20.34 £16.25 £16.00
25th Percentile £43.06 £25.29 £17.88
Median hourly rate £61.03 £64.68 £21.00
Median % change year-on-year -5.64% +207.98% -0.24%
75th Percentile £76.55 £75.00 £50.88
90th Percentile £87.53 £80.25 £72.66
South East median hourly rate £57.35 £60.00 £45.00
% change year-on-year -4.42% +33.33% +5.88%

Security Cleared
Job Vacancy Trend in the Thames Valley

Job postings citing Security Cleared as a proportion of all IT jobs advertised in the Thames Valley.
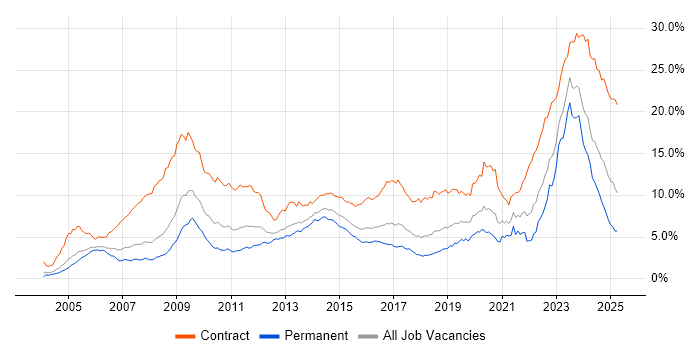
Job vacancy trend for Security Cleared in the Thames Valley

Security Cleared
Contractor Daily Rate Trend in the Thames Valley

3-month moving average daily rate quoted in jobs citing Security Cleared in the Thames Valley.

Daily rate trend for Security Cleared in the Thames Valley

Security Cleared
Daily Rate Histogram in the Thames Valley

Daily rate distribution for jobs citing Security Cleared in the Thames Valley over the 6 months to 1 June 2024.

Daily rate histogram for Security Cleared in the Thames Valley

Security Cleared
Contractor Hourly Rate Trend in the Thames Valley

3-month moving average hourly rates quoted in jobs citing Security Cleared in the Thames Valley.

Hourly rate trend for Security Cleared in the Thames Valley

Security Cleared
Hourly Rate Histogram in the Thames Valley

Hourly rate distribution of jobs citing Security Cleared in the Thames Valley over the 6 months to 1 June 2024.

Hourly rate histogram for Security Cleared in the Thames Valley

Security Cleared
Contract Job Locations in the Thames Valley

The table below looks at the demand and provides a guide to the median contractor rates quoted in IT jobs citing Security Cleared within the Thames Valley region over the 6 months to 1 June 2024. The 'Rank Change' column provides an indication of the change in demand within each location based on the same 6 month period last year.

Location Rank Change
on Same Period
Last Year
Matching
Contract
IT Job Ads
Median
Daily Rate
Past 6 Months
Median Daily Rate
% Change
on Same Period
Last Year
Live
Jobs
Berkshire +2 585 £600 +4.35% 140
Buckinghamshire 0 148 £511 +8.72% 37
Oxfordshire -11 8 £650 +44.44% 22
Security Cleared
South East

Security Cleared
Co-occurring Skills and Capabilities in the Thames Valley by Category

The follow tables expand on the table above by listing co-occurrences grouped by category. The same employment type, locality and period is covered with up to 20 co-occurrences shown in each of the following categories:

Application Platforms
1 28 (3.78%) Microsoft Exchange
2 8 (1.08%) SharePoint
3 3 (0.40%) OpenStack
4 2 (0.27%) Confluence
5 1 (0.13%) JBoss
5 1 (0.13%) Moodle
5 1 (0.13%) Oracle Spatial
5 1 (0.13%) Red Hat Fuse
Applications
1 61 (8.23%) Microsoft Office
2 17 (2.29%) Microsoft Excel
3 9 (1.21%) Microsoft PowerPoint
4 7 (0.94%) Microsoft Project
4 7 (0.94%) Spreadsheet
5 5 (0.67%) Siemens NX
6 4 (0.54%) MS Visio
7 2 (0.27%) Adobe After Effects
7 2 (0.27%) Adobe Premiere
7 2 (0.27%) CINEMA 4D
8 1 (0.13%) 3ds Max
8 1 (0.13%) Blender
Business Applications
1 27 (3.64%) SAP QM
2 26 (3.51%) Primavera
3 22 (2.97%) SAP EWM
4 11 (1.48%) SAP S/4HANA
5 8 (1.08%) Teamcenter
6 1 (0.13%) SAP PLM
Cloud Services
1 116 (15.65%) Azure
2 46 (6.21%) AWS
3 43 (5.80%) Microsoft 365
4 22 (2.97%) Entra ID
4 22 (2.97%) OpenShift
5 21 (2.83%) Azure Monitor
6 20 (2.70%) Azure Storage
7 14 (1.89%) OCI
8 11 (1.48%) Azure DevOps
9 5 (0.67%) PaaS
10 3 (0.40%) Amazon ECS
10 3 (0.40%) Amazon EKS
10 3 (0.40%) SaaS
10 3 (0.40%) Serverless
11 2 (0.27%) Amazon S3
11 2 (0.27%) Amazon SQS
11 2 (0.27%) GCP
11 2 (0.27%) Power Automate
11 2 (0.27%) Power Platform
11 2 (0.27%) Slack
Communications & Networking
1 94 (12.69%) Firewall
2 59 (7.96%) DNS
3 53 (7.15%) DHCP
4 47 (6.34%) LAN
5 46 (6.21%) WAN
6 28 (3.78%) Intrusion Detection
6 28 (3.78%) SAN
7 20 (2.70%) TCP/IP
8 15 (2.02%) Network Security
9 11 (1.48%) Cisco ASA
9 11 (1.48%) Cisco ISE
10 10 (1.35%) SSL
10 10 (1.35%) VPN
11 8 (1.08%) MPLS
12 7 (0.94%) BGP
12 7 (0.94%) SD-WAN
13 4 (0.54%) Cisco Firepower
13 4 (0.54%) Internet
13 4 (0.54%) IPsec
13 4 (0.54%) VSAN
Database & Business Intelligence
1 33 (4.45%) PostgreSQL
2 25 (3.37%) Oracle Database
3 14 (1.89%) Elasticsearch
4 12 (1.62%) Oracle Database 11g
5 10 (1.35%) SAP HANA
6 6 (0.81%) SQL Server
7 4 (0.54%) Relational Database
8 3 (0.40%) MySQL
9 2 (0.27%) MongoDB
10 1 (0.13%) GIS
10 1 (0.13%) Power BI
10 1 (0.13%) Spatial Data
Development Applications
1 38 (5.13%) Jenkins
2 29 (3.91%) Selenium
3 25 (3.37%) Cucumber
4 24 (3.24%) REST Assured
4 24 (3.24%) SonarQube
5 17 (2.29%) GitLab
6 15 (2.02%) JIRA
7 14 (1.89%) Git
8 7 (0.94%) Visual Studio
9 5 (0.67%) MSI
10 4 (0.54%) Artifactory
10 4 (0.54%) Bitbucket
10 4 (0.54%) InstallShield
11 3 (0.40%) JMeter
11 3 (0.40%) Rational DOORS
11 3 (0.40%) Robot Framework
12 1 (0.13%) JUnit
12 1 (0.13%) NUnit
12 1 (0.13%) SpecFlow
12 1 (0.13%) TeamCity
General
1 170 (22.94%) Social Skills
2 153 (20.65%) Public Sector
3 60 (8.10%) Analytical Skills
4 34 (4.59%) Organisational Skills
5 21 (2.83%) Finance
6 20 (2.70%) Law
7 16 (2.16%) Military
8 13 (1.75%) Police
8 13 (1.75%) Presentation Skills
9 10 (1.35%) Telecoms
10 8 (1.08%) Aviation
10 8 (1.08%) Manufacturing
11 4 (0.54%) Electronics
11 4 (0.54%) Inclusion and Diversity
11 4 (0.54%) Pharmaceutical
12 3 (0.40%) Influencing Skills
12 3 (0.40%) Marketing
13 2 (0.27%) Environmental Health
13 2 (0.27%) Legal
14 1 (0.13%) Aerospace
Job Titles
1 117 (15.79%) Architect
2 113 (15.25%) Senior
3 71 (9.58%) Consultant
4 60 (8.10%) SAP Consultant
5 55 (7.42%) Developer
6 51 (6.88%) Analyst
7 49 (6.61%) Security Architect
8 41 (5.53%) Infrastructure Engineer
9 37 (4.99%) Active Directory Support
10 33 (4.45%) Support Engineer
11 30 (4.05%) Administrator
11 30 (4.05%) Support Specialist
11 30 (4.05%) Systems Administrator
12 27 (3.64%) Project Manager
13 26 (3.51%) Active Directory Specialist
13 26 (3.51%) Azure Specialist
13 26 (3.51%) Cybersecurity Architect
13 26 (3.51%) SAP QM Consultant
14 23 (3.10%) Network Engineer
14 23 (3.10%) Solutions Architect
Libraries, Frameworks & Software Standards
1 33 (4.45%) ARM Templates
2 28 (3.78%) REST
3 25 (3.37%) Java EE
4 13 (1.75%) Itk
4 13 (1.75%) Kafka
5 12 (1.62%) Web Services
6 10 (1.35%) .NET
6 10 (1.35%) SAP Basis
7 8 (1.08%) ASP.NET
8 7 (0.94%) SAP Fiori
9 5 (0.67%) Elastic Stack
10 4 (0.54%) YAML
11 3 (0.40%) Node.js
11 3 (0.40%) React
11 3 (0.40%) Spring
11 3 (0.40%) Spring Boot
12 2 (0.27%) .NET Core
12 2 (0.27%) AngularJS
12 2 (0.27%) Fluent Bit
12 2 (0.27%) Loki
Miscellaneous
1 42 (5.67%) PKI
2 26 (3.51%) Driving Licence
2 26 (3.51%) Self-Motivation
3 23 (3.10%) Data Centre
4 15 (2.02%) Cloud Native
5 10 (1.35%) Data Protection Act
6 8 (1.08%) Client/Server
6 8 (1.08%) Product Ownership
7 7 (0.94%) Management Information System
8 6 (0.81%) Private Cloud
9 5 (0.67%) Security Posture
10 4 (0.54%) Cyber Threat
10 4 (0.54%) Distributed Systems
10 4 (0.54%) Linux Command Line
10 4 (0.54%) Public Cloud
11 3 (0.40%) Onboarding
11 3 (0.40%) Operational Technology
11 3 (0.40%) PMI
11 3 (0.40%) Robotics
11 3 (0.40%) Thin Client
Operating Systems
1 133 (17.95%) Windows
2 90 (12.15%) Linux
3 76 (10.26%) Windows Server
4 68 (9.18%) Windows 10
5 64 (8.64%) Windows Server 2019
6 61 (8.23%) Windows Server 2016
7 35 (4.72%) Windows 7
8 32 (4.32%) Windows Server 2012
9 17 (2.29%) Windows NT
10 15 (2.02%) Red Hat Enterprise Linux
11 14 (1.89%) Windows XP
12 13 (1.75%) Ubuntu
13 11 (1.48%) Debian
14 5 (0.67%) Unix
15 2 (0.27%) VMS
16 1 (0.13%) Apple iOS
16 1 (0.13%) CentOS
Processes & Methodologies
1 134 (18.08%) DevOps
2 129 (17.41%) ITIL
3 126 (17.00%) Problem-Solving
4 101 (13.63%) Agile
5 68 (9.18%) Stakeholder Management
6 62 (8.37%) Customer Service
7 57 (7.69%) Project Management
7 57 (7.69%) Release Management
8 54 (7.29%) Software Engineering
9 52 (7.02%) Infrastructure Engineering
10 51 (6.88%) Service Management
11 50 (6.75%) Change Management
12 49 (6.61%) Performance Tuning
13 45 (6.07%) Cybersecurity
13 45 (6.07%) Decision-Making
14 42 (5.67%) Configuration Management
15 39 (5.26%) User Acceptance Testing
16 38 (5.13%) Infrastructure as Code
17 36 (4.86%) Security Architecture
18 35 (4.72%) Test Automation
Programming Languages
1 77 (10.39%) PowerShell
2 35 (4.72%) C#
2 35 (4.72%) Python
3 31 (4.18%) Java
4 28 (3.78%) VBScript
5 20 (2.70%) Bicep
5 20 (2.70%) VB
6 17 (2.29%) SQL
7 12 (1.62%) PL/SQL
8 10 (1.35%) C
9 8 (1.08%) Bash
10 6 (0.81%) C++
11 5 (0.67%) JavaScript
12 3 (0.40%) Shell Script
13 2 (0.27%) Go
14 1 (0.13%) Perl
14 1 (0.13%) T-SQL
Qualifications
1 398 (53.71%) DV Cleared
2 361 (48.72%) SC Cleared
3 82 (11.07%) Degree
4 32 (4.32%) Cisco Certification
5 29 (3.91%) CCNP
6 21 (2.83%) ITIL Foundation Certificate
7 18 (2.43%) CCNA
8 9 (1.21%) BPSS Clearance
9 8 (1.08%) APMP
9 8 (1.08%) ISEB
10 6 (0.81%) PMI Certification
11 5 (0.67%) CISM
11 5 (0.67%) Microsoft Certification
11 5 (0.67%) PRINCE2 Practitioner
12 4 (0.54%) VCAP
12 4 (0.54%) VMware Certified Professional (VCP)
13 3 (0.40%) ITIL Certification
13 3 (0.40%) MCSE
13 3 (0.40%) PMP
14 2 (0.27%) HND
Quality Assurance & Compliance
1 21 (2.83%) QA
2 20 (2.70%) SLA
3 9 (1.21%) PMO
4 7 (0.94%) NCSC
5 6 (0.81%) NIST
6 5 (0.67%) ISO 9000
7 1 (0.13%) Data Quality
7 1 (0.13%) GDPR
System Software
1 102 (13.77%) Active Directory
2 42 (5.67%) VMware Infrastructure
3 34 (4.59%) Firmware
4 25 (3.37%) Hyper-V
5 22 (2.97%) Virtual Machines
6 20 (2.70%) Docker
6 20 (2.70%) Virtual Desktop
7 17 (2.29%) VMware ESXi
8 6 (0.81%) vSphere
9 5 (0.67%) Microsoft App-V
10 4 (0.54%) VMware NSX
11 3 (0.40%) Slurm Workload Manager
12 1 (0.13%) NFS
12 1 (0.13%) vCloud
12 1 (0.13%) XenApp
12 1 (0.13%) XenDesktop
Systems Management
1 87 (11.74%) SCCM
2 61 (8.23%) Kubernetes
3 55 (7.42%) WSUS
4 46 (6.21%) Ansible
5 40 (5.40%) SCOM
6 24 (3.24%) Active Directory Federation Services
7 23 (3.10%) Microsoft Intune
8 22 (2.97%) Terraform
9 17 (2.29%) Grafana
9 17 (2.29%) Sysprep
9 17 (2.29%) vCenter Server
10 15 (2.02%) Istio
11 14 (1.89%) EMC NetWorker
11 14 (1.89%) NetBackup
12 13 (1.75%) Argo
12 13 (1.75%) Nessus
12 13 (1.75%) Prometheus
13 12 (1.62%) Docker Swarm
13 12 (1.62%) Podman
14 11 (1.48%) Kibana
Vendors
1 202 (27.26%) Microsoft
2 82 (11.07%) VMware
3 69 (9.31%) SAP
4 56 (7.56%) Cisco
5 47 (6.34%) Juniper
6 45 (6.07%) HP
6 45 (6.07%) Oracle
7 25 (3.37%) Palo Alto
8 23 (3.10%) Red Hat
9 19 (2.56%) ServiceNow
9 19 (2.56%) Veeam
10 16 (2.16%) Dell
11 14 (1.89%) 3PAR
11 14 (1.89%) EMC
11 14 (1.89%) Extreme Networks
11 14 (1.89%) Symantec
12 11 (1.48%) ScienceLogic
13 5 (0.67%) NEC
13 5 (0.67%) Siemens
14 4 (0.54%) Apple