Security Cleared Jobs in the Thames Valley

Security Clearance
South East > Thames Valley

The table below provides summary statistics for permanent job vacancies advertised in the Thames Valley with a requirement for Security Cleared qualifications. It includes a benchmarking guide to the salaries offered over the 6 months leading up to 9 May 2025, comparing them to the same period in the previous two years.

6 months to
9 May 2025
Same period 2024 Same period 2023
Rank 54 8 14
Rank change year-on-year -46 +6 +49
Permanent jobs citing Security Cleared 166 933 721
As % of all permanent jobs advertised in the Thames Valley 4.95% 13.89% 12.02%
As % of the Qualifications category 10.01% 36.20% 28.70%
Number of salaries quoted 108 610 363
10th Percentile £40,000 £30,000 £25,500
25th Percentile £47,875 £36,375 £35,463
Median annual salary (50th Percentile) £59,000 £53,409 £45,600
Median % change year-on-year +10.47% +17.13% -17.20%
75th Percentile £69,063 £61,738 £61,875
90th Percentile £78,750 £76,375 £75,000
South East median annual salary £57,500 £55,000 £49,250
% change year-on-year +4.55% +11.68% -11.26%

All Academic and Professional Certifications
Thames Valley

Security Cleared falls under the Academic Qualifications and Professional Certifications category. For comparison with the information above, the following table provides summary statistics for all permanent job vacancies requiring academic qualifications or professional certifications in the Thames Valley.

Permanent vacancies requiring academic qualifications or professional certifications 1,658 2,577 2,512
As % of all permanent jobs advertised in the Thames Valley 49.45% 38.36% 41.87%
Number of salaries quoted 437 1,575 1,042
10th Percentile £31,250 £30,000 £26,250
25th Percentile £41,250 £38,000 £34,992
Median annual salary (50th Percentile) £52,500 £52,500 £48,850
Median % change year-on-year - +7.47% -6.06%
75th Percentile £70,000 £68,500 £68,563
90th Percentile £85,000 £85,000 £85,000
South East median annual salary £57,500 £51,500 £50,000
% change year-on-year +11.65% +3.00% -4.76%

Security Cleared
Job Vacancy Trend in the Thames Valley

Job postings citing Security Cleared as a proportion of all IT jobs advertised in the Thames Valley.
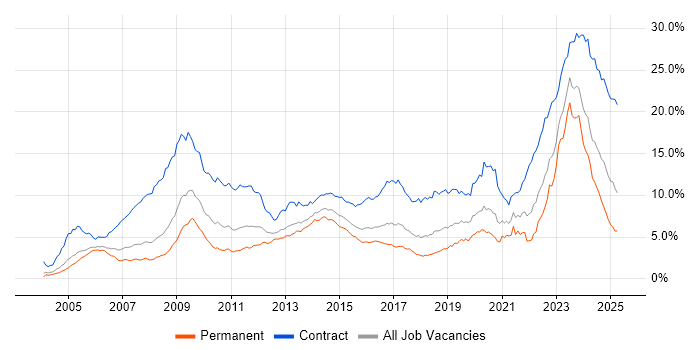
Job vacancy trend for Security Cleared in the Thames Valley

Security Cleared
Salary Trend in the Thames Valley

3-month moving average salary quoted in jobs citing Security Cleared in the Thames Valley.

Salary trend for Security Cleared in the Thames Valley

Security Cleared
Salary Histogram in the Thames Valley

Salary distribution for jobs citing Security Cleared in the Thames Valley over the 6 months to 9 May 2025.

Salary histogram for Security Cleared in the Thames Valley

Security Cleared
Job Locations in the Thames Valley

The table below looks at the demand and provides a guide to the median salaries quoted in IT jobs citing Security Cleared within the Thames Valley region over the 6 months to 9 May 2025. The 'Rank Change' column provides an indication of the change in demand within each location based on the same 6 month period last year.

Location Rank Change
on Same Period
Last Year
Matching
Permanent
IT Job Ads
Median Salary
Past 6 Months
Median Salary
% Change
on Same Period
Last Year
Live
Jobs
Berkshire -31 114 £61,250 +16.56% 158
Buckinghamshire -28 31 £57,500 +4.55% 33
Oxfordshire +6 21 £50,000 -2.00% 53
Security Cleared
South East

Security Cleared
Co-occurring Skills and Capabilities in the Thames Valley by Category

The follow tables expand on the table above by listing co-occurrences grouped by category. The same employment type, locality and period is covered with up to 20 co-occurrences shown in each of the following categories:

Application Platforms
1 13 (7.83%) JBoss
1 13 (7.83%) Red Hat Fuse
2 1 (0.60%) OpenStack
Applications
1 4 (2.41%) Microsoft Excel
1 4 (2.41%) Mozilla Thunderbird
2 2 (1.20%) Microsoft Office
3 1 (0.60%) Trello
Business Applications
1 5 (3.01%) Q-Pulse
Cloud Services
1 51 (30.72%) AWS
2 32 (19.28%) Serverless
3 30 (18.07%) Amazon ECS
4 29 (17.47%) Amazon EKS
5 19 (11.45%) Azure
6 16 (9.64%) Amazon EC2
7 8 (4.82%) SaaS
8 7 (4.22%) Power Platform
9 6 (3.61%) Amazon S3
9 6 (3.61%) AWS Lambda
9 6 (3.61%) Dynamics 365
9 6 (3.61%) GCP
10 5 (3.01%) AWS KMS
11 4 (2.41%) Amazon GuardDuty
11 4 (2.41%) GitHub
11 4 (2.41%) IaaS
11 4 (2.41%) PaaS
11 4 (2.41%) Virtual Private Cloud
12 3 (1.81%) AWS CloudFormation
12 3 (1.81%) Microsoft 365
Communications & Networking
1 17 (10.24%) WAN
2 14 (8.43%) Cisco ISE
3 9 (5.42%) BGP
3 9 (5.42%) IPsec
4 8 (4.82%) DNS
4 8 (4.82%) Firewall
5 6 (3.61%) MPLS
5 6 (3.61%) SSL
5 6 (3.61%) VPN
6 5 (3.01%) Junos
6 5 (3.01%) LAN
6 5 (3.01%) SD-WAN
6 5 (3.01%) VLAN
7 4 (2.41%) Cisco ASA
7 4 (2.41%) Cisco Firepower
7 4 (2.41%) Cisco IOS
7 4 (2.41%) Cisco Nexus
7 4 (2.41%) HSRP
7 4 (2.41%) OSPF
7 4 (2.41%) Spanning Tree
Database & Business Intelligence
1 36 (21.69%) PostgreSQL
2 29 (17.47%) Relational Database
3 13 (7.83%) RDBMS
4 8 (4.82%) MongoDB
5 5 (3.01%) Power BI
6 4 (2.41%) Elasticsearch
6 4 (2.41%) MySQL
6 4 (2.41%) Tableau
7 3 (1.81%) SQL Server
8 2 (1.20%) Amazon RDS
8 2 (1.20%) Metadata
9 1 (0.60%) Amazon Aurora
9 1 (0.60%) Data Warehouse
9 1 (0.60%) Looker
9 1 (0.60%) NoSQL
Development Applications
1 40 (24.10%) Jenkins
2 31 (18.67%) JUnit
3 21 (12.65%) Git
4 18 (10.84%) Mockito
5 13 (7.83%) JMeter
6 4 (2.41%) Bitbucket Server
7 3 (1.81%) GitLab
7 3 (1.81%) JIRA
7 3 (1.81%) SonarQube
8 2 (1.20%) Babel
8 2 (1.20%) Maven
8 2 (1.20%) Vite
8 2 (1.20%) webpack
9 1 (0.60%) Artifactory
9 1 (0.60%) Cucumber
9 1 (0.60%) DbUnit
9 1 (0.60%) jMock
9 1 (0.60%) LabVIEW
General
1 46 (27.71%) Public Sector
2 24 (14.46%) Social Skills
3 16 (9.64%) Analytical Skills
4 13 (7.83%) Finance
5 8 (4.82%) Inclusion and Diversity
6 7 (4.22%) Advertising
6 7 (4.22%) Aerospace
7 6 (3.61%) Aviation
7 6 (3.61%) Military
8 5 (3.01%) Presentation Skills
9 3 (1.81%) Legal
10 1 (0.60%) Law
10 1 (0.60%) Local Government
10 1 (0.60%) Organisational Skills
Job Titles
1 41 (24.70%) Developer
2 31 (18.67%) Java Developer
3 26 (15.66%) Architect
4 18 (10.84%) Network Architect
5 17 (10.24%) Software Engineer
6 13 (7.83%) Senior
7 10 (6.02%) Support Engineer
8 9 (5.42%) Designer
8 9 (5.42%) Network Designer
8 9 (5.42%) Network Engineer
9 7 (4.22%) DevOps Engineer
10 6 (3.61%) Analyst
10 6 (3.61%) Consultant
10 6 (3.61%) Dynamics 365 Developer
11 5 (3.01%) 3rd Line Engineer
11 5 (3.01%) 3rd Line Network Engineer
11 5 (3.01%) Lead
11 5 (3.01%) Microsoft Developer
11 5 (3.01%) Senior Software Engineer
11 5 (3.01%) Systems Engineer
Libraries, Frameworks & Software Standards
1 35 (21.08%) REST
2 32 (19.28%) Spring Boot
3 31 (18.67%) Spring
4 27 (16.27%) Web Services
5 26 (15.66%) Apache Camel
6 19 (11.45%) RESTful
7 18 (10.84%) SOAP
8 17 (10.24%) ActiveMQ
8 17 (10.24%) Hibernate
9 16 (9.64%) HTML
10 13 (7.83%) J2EE
10 13 (7.83%) jQuery
10 13 (7.83%) WireMock
11 12 (7.23%) React
12 9 (5.42%) Kafka
13 7 (4.22%) AngularJS
14 6 (3.61%) XML
15 5 (3.01%) RabbitMQ
16 4 (2.41%) 802.1X
16 4 (2.41%) Vue
Miscellaneous
1 29 (17.47%) Distributed Systems
2 12 (7.23%) Algorithms
3 6 (3.61%) Management Information System
4 5 (3.01%) e-Learning
4 5 (3.01%) Linux Command Line
4 5 (3.01%) Reference Data
5 4 (2.41%) CESG
5 4 (2.41%) Data Centre
6 3 (1.81%) Client/Server
6 3 (1.81%) Cloud Native
6 3 (1.81%) Cyber Threat
6 3 (1.81%) Cyberattack
6 3 (1.81%) Private Cloud
6 3 (1.81%) Product Ownership
7 2 (1.20%) Enterprise Cloud
7 2 (1.20%) Freedom of Information
7 2 (1.20%) Freedom of Information Act
7 2 (1.20%) PKI
8 1 (0.60%) CCTV
8 1 (0.60%) Hybrid Cloud
Operating Systems
1 29 (17.47%) Linux
2 12 (7.23%) Windows
3 9 (5.42%) Unix
4 4 (2.41%) Mac OS
4 4 (2.41%) Ubuntu
5 2 (1.20%) Android
5 2 (1.20%) Windows 10
5 2 (1.20%) Windows Server
6 1 (0.60%) Red Hat Enterprise Linux
Processes & Methodologies
1 52 (31.33%) Agile
2 37 (22.29%) Scrum
3 35 (21.08%) DevOps
3 35 (21.08%) Microservices
4 30 (18.07%) Kanban
5 28 (16.87%) TDD
6 27 (16.27%) BDD
6 27 (16.27%) CI/CD
7 23 (13.86%) Software Engineering
8 19 (11.45%) Collaborative Working
8 19 (11.45%) Containerisation
9 18 (10.84%) SDLC
10 17 (10.24%) Full-Stack Development
10 17 (10.24%) Problem-Solving
11 16 (9.64%) Network Management
12 14 (8.43%) Open Source
12 14 (8.43%) Workflow
13 13 (7.83%) Computer Science
13 13 (7.83%) Migration
13 13 (7.83%) Process Management
Programming Languages
1 46 (27.71%) Python
2 41 (24.70%) Java
3 27 (16.27%) JavaScript
4 20 (12.05%) SQL
5 18 (10.84%) Shell Script
6 11 (6.63%) C++
7 10 (6.02%) Bash
8 8 (4.82%) C
8 8 (4.82%) Fortran
9 7 (4.22%) PL/SQL
10 5 (3.01%) PowerShell
11 4 (2.41%) Go
11 4 (2.41%) TypeScript
12 3 (1.81%) C#
13 2 (1.20%) Rust
14 1 (0.60%) Google Apps Script
14 1 (0.60%) Groovy
14 1 (0.60%) Kusto Query Language
14 1 (0.60%) Perl
14 1 (0.60%) X++
Qualifications
1 131 (78.92%) SC Cleared
2 30 (18.07%) DV Cleared
3 23 (13.86%) Degree
4 10 (6.02%) CCNP
4 10 (6.02%) Cisco Certification
5 9 (5.42%) Master's Degree
5 9 (5.42%) PhD
6 8 (4.82%) CISSP
7 7 (4.22%) CCNA
8 6 (3.61%) CESG Certified Professional
8 6 (3.61%) JNCIS
9 4 (2.41%) Computer Science Degree
10 3 (1.81%) CompTIA Security+
10 3 (1.81%) ISO 27001 Lead Auditor
10 3 (1.81%) Microsoft Certification
10 3 (1.81%) TOGAF Certification
10 3 (1.81%) VMware Certified Professional (VCP)
11 2 (1.20%) AWS Certification
11 2 (1.20%) CISMP
11 2 (1.20%) MCSE
Quality Assurance & Compliance
1 20 (12.05%) SLA
2 6 (3.61%) Data Quality
3 5 (3.01%) QA
4 4 (2.41%) ISO/IEC 27001
5 2 (1.20%) COSHH
5 2 (1.20%) Def Stans
6 1 (0.60%) Accessibility
6 1 (0.60%) Cyber Essentials
6 1 (0.60%) GDPR
6 1 (0.60%) HIPAA
6 1 (0.60%) ISO 9000
6 1 (0.60%) JSP 440
6 1 (0.60%) NCSC
6 1 (0.60%) NIST
6 1 (0.60%) PMBOK
6 1 (0.60%) RMADS
6 1 (0.60%) SOC 2
System Software
1 47 (28.31%) Docker
2 11 (6.63%) VMware Infrastructure
3 8 (4.82%) Active Directory
4 5 (3.01%) Virtual Machines
5 4 (2.41%) Virtual Desktop
6 3 (1.81%) VMware ESXi
7 2 (1.20%) VMware NSX
7 2 (1.20%) vSphere
8 1 (0.60%) Hyper-V
8 1 (0.60%) NFS
8 1 (0.60%) vCloud
8 1 (0.60%) VMware Workstation
Systems Management
1 37 (22.29%) Kubernetes
2 23 (13.86%) Ansible
3 13 (7.83%) Kibana
4 12 (7.23%) Terraform
5 4 (2.41%) Grafana
5 4 (2.41%) Nessus
5 4 (2.41%) Prometheus
5 4 (2.41%) Proxmox
6 3 (1.81%) Graylog
7 2 (1.20%) PowerCLI
7 2 (1.20%) SCCM
7 2 (1.20%) SCOM
7 2 (1.20%) SCSM
7 2 (1.20%) vCenter Server
7 2 (1.20%) vRealize
8 1 (0.60%) Packer
8 1 (0.60%) QRadar
8 1 (0.60%) VxRail
Vendors
1 36 (21.69%) Juniper
2 33 (19.88%) Cisco
3 22 (13.25%) Microsoft
3 22 (13.25%) VMware
4 14 (8.43%) Splunk
5 13 (7.83%) Dynatrace
6 10 (6.02%) SevOne
7 6 (3.61%) F5
8 4 (2.41%) BMC
9 3 (1.81%) ADVA
9 3 (1.81%) ServiceNow
10 2 (1.20%) AlienVault
10 2 (1.20%) Apple
10 2 (1.20%) Dell
10 2 (1.20%) WSO2
11 1 (0.60%) Cognos
11 1 (0.60%) HP
11 1 (0.60%) IBM
11 1 (0.60%) Oracle
11 1 (0.60%) Red Hat