
Hybrid/Remote Performance Reporting Analyst Contract Job Trends
Performance Reporting Analyst
UK > Work from Home
The median Performance Reporting Analyst daily rate for remote/hybrid work is £400, according to job vacancies posted in the 6 months leading up to 9 November 2026.
The table below compares current contractor rates and summary statistics with the previous two years.
| 6 months to 9 Nov 2026 |
Same period 2025 | Same period 2024 | |
|---|---|---|---|
| Rank | 374 | - | - |
| Rank change year-on-year | - | - | - |
| Contract Performance Reporting Analyst jobs | 1 | 0 | 0 |
| As % of all contract jobs with remote/hybrid work options | 0.007% | - | - |
| As % of the Job Titles category | 0.008% | - | - |
| Number of daily rates quoted | 1 | 0 | 0 |
| 10th Percentile | - | - | - |
| 25th Percentile | £350 | - | - |
| Median daily rate (50th Percentile) | £400 | - | - |
| 75th Percentile | £450 | - | - |
| 90th Percentile | - | - | - |
| UK median daily rate | £400 | - | - |
All Contract IT Job Roles
Work from Home
For comparison with the information above, the following table provides summary statistics for all contract IT job adverts with remote/hybrid work options and matching a recognised job title. The table also shows what proportion of all contract IT job adverts they make up.
| 6 months to 9 Nov 2026 |
Same period 2025 | Same period 2024 | |
|---|---|---|---|
| Contract remote/hybrid job adverts matching a recognised job title | 12,628 | 9,444 | 11,353 |
| % of contract job adverts matching a recognised job title | 92.82% | 93.75% | 93.23% |
| Number of daily rates quoted | 7,925 | 6,190 | 7,129 |
| 10th Percentile | £356 | £325 | £325 |
| 25th Percentile | £430 | £413 | £413 |
| Median daily rate (50th Percentile) | £525 | £517 | £525 |
| Median % change year-on-year | +1.55% | -1.52% | - |
| 75th Percentile | £625 | £625 | £630 |
| 90th Percentile | £725 | £725 | £738 |
| UK median daily rate | £525 | £500 | £525 |
| % change year-on-year | +5.00% | -4.76% | - |
| Number of hourly rates quoted | 773 | 328 | 197 |
| 10th Percentile | £15.26 | £14.82 | £19.18 |
| 25th Percentile | £25.49 | £20.50 | £24.84 |
| Median hourly rate | £54.50 | £41.68 | £40.00 |
| Median % change year-on-year | +30.76% | +4.20% | -20.00% |
| 75th Percentile | £70.00 | £65.00 | £66.00 |
| 90th Percentile | £81.25 | £68.00 | £73.00 |
| UK median hourly rate | £40.32 | £25.15 | £36.00 |
| % change year-on-year | +60.32% | -30.14% | -19.10% |
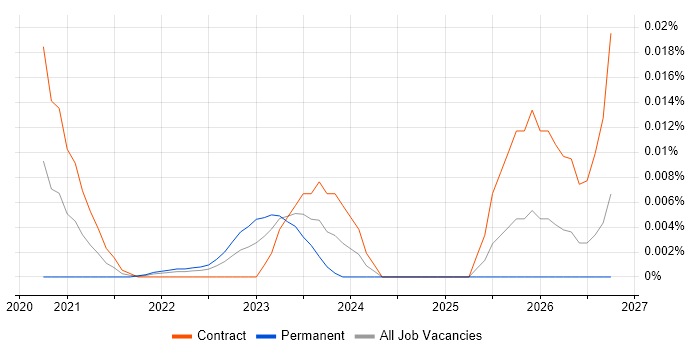
Performance Reporting Analyst Job Vacancy Trend for Remote/Hybrid Roles
Historical trend showing the proportion of contract Performance Reporting Analyst job postings offering remote/hybrid work options relative to all contract IT jobs advertised.
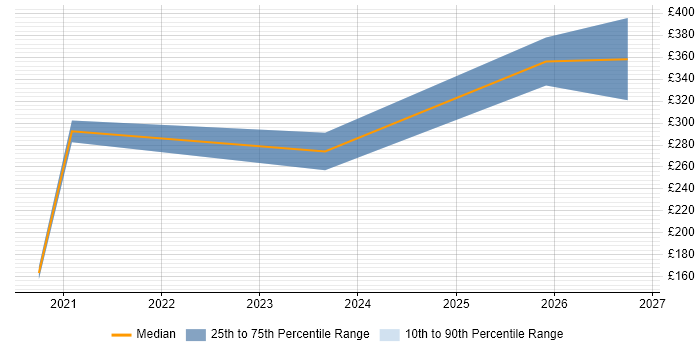
Performance Reporting Analyst Daily Rate Trend for Remote/Hybrid Jobs
Contractor daily rate distribution trend for remote/hybrid Performance Reporting Analyst job vacancies.
Performance Reporting Analyst Skill Set Top 16 Co-Occurring Skills & Capabilities in Remote/Hybrid Jobs
For the 6 months to 9 November 2026, Performance Reporting Analyst contract job ads cited the following skills and capabilities in order of popularity. The figures indicate the absolute number of co-occurrences and as a proportion of all contract Performance Reporting Analyst jobs with remote/hybrid work options.
| Rank | Skill | Share | Job Ads |
|---|---|---|---|
| 1 | Business Intelligence | 100.0% | 1 |
| 1 | Continuous Improvement | 100.0% | 1 |
| 1 | Data Analysis | 100.0% | 1 |
| 1 | Data-Driven Decision Making | 100.0% | 1 |
| 1 | Decision-Making | 100.0% | 1 |
| 1 | Microsoft Excel | 100.0% | 1 |
| 1 | Performance Improvement | 100.0% | 1 |
| 1 | Performance Management | 100.0% | 1 |
| 1 | Performance Monitoring | 100.0% | 1 |
| 1 | Power BI | 100.0% | 1 |
| 1 | Power Platform | 100.0% | 1 |
| 1 | Requirements Gathering | 100.0% | 1 |
| 1 | Scorecard | 100.0% | 1 |
| 1 | Stakeholder Engagement | 100.0% | 1 |
| 1 | Stakeholder Management | 100.0% | 1 |
| 1 | Visualisation | 100.0% | 1 |
Performance Reporting Analyst Skill Set Co-Occurring Skills & Capabilities in Remote/Hybrid Jobs by Category
The table below expands on the one above by listing co-occurrences one category at a time. It covers the same employment type, locality and period, with up to 20 co-occurrences in each category.
Job Titles
| Rank | Job Title | Share | Job Ads |
|---|---|---|---|
| 1 | Report Analyst | 100.0% | 1 |