Microsoft Excel Contracts with Hybrid/Remote/WFH Options

Microsoft Excel
UK > Work from Home

The table below provides summary statistics for remote or hybrid contract work requiring Microsoft Excel skills. It includes a benchmarking guide to the contractor rates offered in vacancies that cited Microsoft Excel over the 6 months leading up to 1 May 2025, comparing them to the same period in the previous two years.

6 months to
1 May 2025
Same period 2024 Same period 2023
Rank 83 84 86
Rank change year-on-year +1 +2 +13
Contract jobs citing Microsoft Excel 291 370 677
As % of all contract jobs with a WFH option 2.94% 2.41% 2.62%
As % of the Applications category 40.99% 31.60% 40.23%
Number of daily rates quoted 184 205 477
10th Percentile £225 £192 £228
25th Percentile £296 £313 £350
Median daily rate (50th Percentile) £400 £450 £425
Median % change year-on-year -11.11% +5.88% -
75th Percentile £524 £575 £550
90th Percentile £659 £752 £700
UK median daily rate £400 £440 £425
% change year-on-year -9.09% +3.53% -
Number of hourly rates quoted 26 72 27
10th Percentile £13.50 £12.29 £12.50
25th Percentile - £13.99 £15.38
Median hourly rate £14.20 £20.77 £22.75
Median % change year-on-year -31.63% -8.70% +8.33%
75th Percentile £21.00 £26.50 £46.69
90th Percentile £23.69 £44.79 £65.00
UK median hourly rate £17.00 £14.80 £22.88
% change year-on-year +14.86% -35.30% +17.19%

All Software Application Skills
Work from Home

Microsoft Excel falls under the Software Applications category. For comparison with the information above, the following table provides summary statistics for all contract job vacancies with remote or hybrid options requiring software application skills.

Contract vacancies with a requirement for software application skills 710 1,171 1,683
As % of all contract jobs with a WFH option 7.17% 7.63% 6.51%
Number of daily rates quoted 437 512 1,152
10th Percentile £211 £183 £213
25th Percentile £263 £285 £338
Median daily rate (50th Percentile) £413 £425 £450
Median % change year-on-year -2.94% -5.56% -
75th Percentile £550 £550 £588
90th Percentile £650 £710 £700
UK median daily rate £413 £400 £425
% change year-on-year +3.13% -5.88% -0.70%
Number of hourly rates quoted 54 179 101
10th Percentile £14.00 £12.96 £15.75
25th Percentile £14.20 £15.46 £24.50
Median hourly rate £17.03 £35.00 £45.00
Median % change year-on-year -51.36% -22.22% +63.13%
75th Percentile £32.05 £57.50 £52.50
90th Percentile £65.25 £66.00 £68.75
UK median hourly rate £23.59 £17.72 £36.50
% change year-on-year +33.13% -51.45% +69.77%

Microsoft Excel
Trend for Jobs with a WFH Option

Job vacancies with remote working options citing Microsoft Excel as a proportion of all IT jobs advertised.
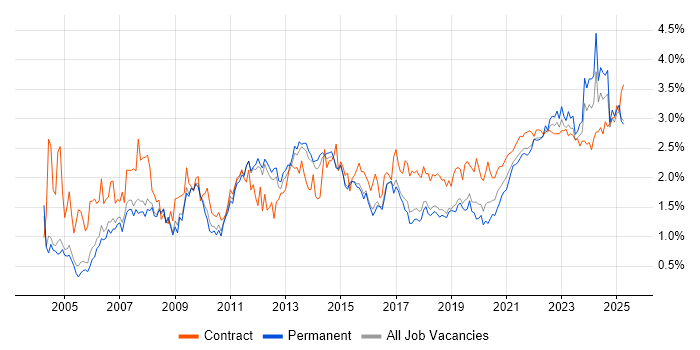
Microsoft Excel trend for jobs with Hybrid/Remote/WFH options

Microsoft Excel
Daily Rate Trend for Jobs with a WFH Option

3-month moving average daily rate quoted in job vacancies with remote working options citing Microsoft Excel.

Microsoft Excel daily rate for jobs with a WFH option

Microsoft Excel
Daily Rate Histogram for Jobs with a WFH Option

Daily rate distribution for jobs with remote working options citing Microsoft Excel over the 6 months to 1 May 2025.

Microsoft Excel daily rate histogram for jobs with a WFH option

Microsoft Excel
Hourly Rate Trend for Jobs with a WFH Option

3-month moving average hourly rate quoted in job vacancies with remote working options citing Microsoft Excel.

Microsoft Excel hourly rate for jobs with a WFH option

Microsoft Excel
Hourly Rate Histogram for Jobs with a WFH Option

Hourly rate distribution for jobs with remote working options citing Microsoft Excel over the 6 months to 1 May 2025.

Microsoft Excel hourly rate histogram for jobs with a WFH option

Microsoft Excel
Co-occurring Skills and Capabilities with WFH Options by Category

The follow tables expand on the table above by listing co-occurrences grouped by category. The same employment type, locality and period is covered with up to 20 co-occurrences shown in each of the following categories:

Application Platforms
1 41 (14.09%) SharePoint
2 8 (2.75%) Confluence
3 4 (1.37%) SAS
4 3 (1.03%) CMS
4 3 (1.03%) Oracle Coherence
5 1 (0.34%) Microsoft Exchange
5 1 (0.34%) WebLogic
Applications
1 91 (31.27%) Microsoft PowerPoint
2 68 (23.37%) Microsoft Office
3 20 (6.87%) MS Visio
4 14 (4.81%) Microsoft Project
5 6 (2.06%) Spreadsheet
6 2 (0.69%) Oracle Smart View
7 1 (0.34%) Adobe Creative Suite
7 1 (0.34%) Notepad++
7 1 (0.34%) Trello
Business Applications
1 3 (1.03%) SAP MDG
1 3 (1.03%) SAP Retail
2 2 (0.69%) SAP CAR
2 2 (0.69%) SAP MM
2 2 (0.69%) SAP S/4HANA
2 2 (0.69%) Workday HCM
2 2 (0.69%) Workfront
3 1 (0.34%) Aladdin
3 1 (0.34%) Dynamics AX
3 1 (0.34%) IBM Planning Analytics
3 1 (0.34%) Loan IQ
3 1 (0.34%) Oracle ERP
3 1 (0.34%) Oracle Payables
3 1 (0.34%) Raiser’s Edge
3 1 (0.34%) Remedy ITSM
3 1 (0.34%) SAP GRC
3 1 (0.34%) SAP MDM
Cloud Services
1 69 (23.71%) Power Platform
2 23 (7.90%) Microsoft 365
3 8 (2.75%) Azure
4 6 (2.06%) PowerApps
5 5 (1.72%) Power Automate
5 5 (1.72%) SaaS
5 5 (1.72%) Salsify
5 5 (1.72%) Snowflake
5 5 (1.72%) Yammer
6 4 (1.37%) Google Analytics
6 4 (1.37%) IBM Blueworks
7 3 (1.03%) AWS
7 3 (1.03%) Azure DevOps
7 3 (1.03%) Google Data Studio
8 2 (0.69%) Amazon S3
8 2 (0.69%) Dynamics 365
8 2 (0.69%) Entra ID
8 2 (0.69%) Google Sheets
8 2 (0.69%) Lucidchart
8 2 (0.69%) SuccessFactors
Communications & Networking
1 7 (2.41%) Internet
2 6 (2.06%) Firewall
2 6 (2.06%) Wireless
3 3 (1.03%) Radio Access Network
4 2 (0.69%) Intranet
5 1 (0.34%) DHCP
5 1 (0.34%) DNS
5 1 (0.34%) Fibre Channel
5 1 (0.34%) Kerberos
5 1 (0.34%) SAN
5 1 (0.34%) Wi-Fi
Database & Business Intelligence
1 65 (22.34%) Power BI
2 18 (6.19%) Power Query
3 16 (5.50%) SQL Server
4 15 (5.15%) Tableau
5 12 (4.12%) MS Access
6 11 (3.78%) Data Warehouse
7 7 (2.41%) Relational Database
8 6 (2.06%) Data Mining
9 5 (1.72%) SQL Server Reporting Services
10 4 (1.37%) BusinessObjects
11 3 (1.03%) Apache Cassandra
11 3 (1.03%) Big Data
11 3 (1.03%) Looker
12 2 (0.69%) Azure SQL Database
12 2 (0.69%) Data Lake
12 2 (0.69%) Oracle Reports
12 2 (0.69%) PowerPivot
12 2 (0.69%) SQL Server Integration Services
13 1 (0.34%) EDRMS
13 1 (0.34%) Snowflake Schema
Development Applications
1 28 (9.62%) JIRA
2 4 (1.37%) Visual Studio
3 1 (0.34%) MagicDraw
3 1 (0.34%) Postman
3 1 (0.34%) Toad
3 1 (0.34%) XMLSpy
General
1 130 (44.67%) Social Skills
2 91 (31.27%) Finance
3 79 (27.15%) Analytical Skills
4 29 (9.97%) Banking
5 22 (7.56%) Marketing
6 19 (6.53%) Public Sector
7 17 (5.84%) Presentation Skills
8 15 (5.15%) Retail
9 13 (4.47%) Inclusion and Diversity
10 12 (4.12%) Organisational Skills
11 10 (3.44%) Investment Banking
12 6 (2.06%) Legal
12 6 (2.06%) Telecoms
13 5 (1.72%) Back Office
13 5 (1.72%) Front Office
13 5 (1.72%) General Ledger
13 5 (1.72%) Pharmaceutical
13 5 (1.72%) Publishing
14 4 (1.37%) Advertising
14 4 (1.37%) Manufacturing
Job Titles
1 102 (35.05%) Analyst
2 32 (11.00%) Data Analyst
3 19 (6.53%) Business Analyst
3 19 (6.53%) Developer
4 15 (5.15%) Senior
5 13 (4.47%) Data Steward
5 13 (4.47%) Pensions Analyst
5 13 (4.47%) Project Manager
5 13 (4.47%) Support Assistant
6 11 (3.78%) Consultant
6 11 (3.78%) Help Desk Support
7 10 (3.44%) Lead
8 9 (3.09%) Administrator
9 7 (2.41%) Report Analyst
9 7 (2.41%) Support Officer
10 6 (2.06%) Business Intelligence Analyst
10 6 (2.06%) Change Analyst
10 6 (2.06%) Help Desk Agent
11 5 (1.72%) Financial Analyst
11 5 (1.72%) Risk Analyst
Libraries, Frameworks & Software Standards
1 4 (1.37%) .NET
2 3 (1.03%) CSS
2 3 (1.03%) HTML
2 3 (1.03%) Kafka
2 3 (1.03%) REST
3 2 (0.69%) Oracle Fusion
3 2 (0.69%) XML
4 1 (0.34%) Bootstrap
4 1 (0.34%) FpML
4 1 (0.34%) jQuery
4 1 (0.34%) JSON
4 1 (0.34%) MDX
4 1 (0.34%) OAuth
4 1 (0.34%) OpenID
4 1 (0.34%) Playwright
4 1 (0.34%) React
4 1 (0.34%) SailPoint
4 1 (0.34%) SAML
4 1 (0.34%) Web Services
Miscellaneous
1 20 (6.87%) Management Information System
2 11 (3.78%) Onboarding
3 9 (3.09%) Self-Motivation
4 6 (2.06%) PMI
4 6 (2.06%) Reference Data
5 5 (1.72%) Foreign Exchange (FX)
5 5 (1.72%) Renewable Energy
6 4 (1.37%) Credit Risk
6 4 (1.37%) Greenfield Project
7 3 (1.03%) Data Structures
7 3 (1.03%) Digital Media
7 3 (1.03%) Distributed Systems
7 3 (1.03%) Learning Management System
7 3 (1.03%) Mainframe
7 3 (1.03%) Market Risk
7 3 (1.03%) NHS
7 3 (1.03%) Product Ownership
8 2 (0.69%) Derivative
8 2 (0.69%) Linux Command Line
8 2 (0.69%) Virtual Team
Operating Systems
1 11 (3.78%) Unix
2 7 (2.41%) Windows
3 1 (0.34%) Android
3 1 (0.34%) Apple iOS
3 1 (0.34%) Linux
Processes & Methodologies
1 79 (27.15%) Problem-Solving
2 56 (19.24%) Business Intelligence
2 56 (19.24%) Project Management
3 51 (17.53%) Data Analysis
4 38 (13.06%) Agile
5 31 (10.65%) Data Management
6 30 (10.31%) Analytics
7 28 (9.62%) Migration
8 27 (9.28%) Decision-Making
8 27 (9.28%) Time Management
9 26 (8.93%) Change Management
10 25 (8.59%) Stakeholder Management
11 22 (7.56%) Data Governance
11 22 (7.56%) Project Delivery
12 21 (7.22%) Requirements Gathering
12 21 (7.22%) Visualisation
13 19 (6.53%) Continuous Improvement
13 19 (6.53%) Customer Service
14 18 (6.19%) Data Migration
15 17 (5.84%) Data Modelling
Programming Languages
1 86 (29.55%) SQL
2 29 (9.97%) Python
3 20 (6.87%) VBA
4 6 (2.06%) C#
5 5 (1.72%) PowerShell
6 4 (1.37%) Data Analysis Expressions
6 4 (1.37%) Java
7 3 (1.03%) C
7 3 (1.03%) JavaScript
7 3 (1.03%) R
7 3 (1.03%) T-SQL
7 3 (1.03%) VB
8 1 (0.34%) TypeScript
8 1 (0.34%) VB.NET
8 1 (0.34%) VB6
Qualifications
1 55 (18.90%) Degree
2 11 (3.78%) PMI Certification
2 11 (3.78%) Security Cleared
3 9 (3.09%) SC Cleared
4 5 (1.72%) PMP
5 4 (1.37%) CIMA
6 2 (0.69%) ACCA
6 2 (0.69%) CBAP
6 2 (0.69%) Computer Science Degree
6 2 (0.69%) Master's Degree
6 2 (0.69%) Numerate Degree
7 1 (0.34%) APMP
7 1 (0.34%) BPSS Clearance
7 1 (0.34%) CCAB
7 1 (0.34%) CIPFA
7 1 (0.34%) CISM
7 1 (0.34%) CISSP
7 1 (0.34%) ISEB
7 1 (0.34%) ISTQB Foundation Certification
7 1 (0.34%) PRINCE2 Certification
Quality Assurance & Compliance
1 28 (9.62%) Data Quality
2 24 (8.25%) PMO
3 16 (5.50%) SLA
4 11 (3.78%) QA
5 6 (2.06%) GDPR
6 5 (1.72%) MiFID
6 5 (1.72%) Sarbanes-Oxley
7 3 (1.03%) Accessibility
7 3 (1.03%) Disclosure Scotland
7 3 (1.03%) GAAP
7 3 (1.03%) SOC 2
8 2 (0.69%) Actionable Recommendations
8 2 (0.69%) Basel II
8 2 (0.69%) EMIR
8 2 (0.69%) GMP
8 2 (0.69%) IFRS
8 2 (0.69%) IFRS 17
9 1 (0.34%) California Consumer Privacy Act
9 1 (0.34%) GRC
9 1 (0.34%) P3O
System Software
1 4 (1.37%) Active Directory
2 1 (0.34%) BitLocker
2 1 (0.34%) Virtual Desktop
Systems Management
1 1 (0.34%) Microsoft Intune
1 1 (0.34%) SCCM
1 1 (0.34%) SCOrch
1 1 (0.34%) Single Sign-On
Vendors
1 117 (40.21%) Microsoft
2 18 (6.19%) Oracle
2 18 (6.19%) SAP
3 7 (2.41%) Adobe
3 7 (2.41%) ServiceNow
4 6 (2.06%) Google
4 6 (2.06%) Salesforce
5 5 (1.72%) Informatica
5 5 (1.72%) Workday
6 4 (1.37%) Alteryx
7 3 (1.03%) TOWER Software
7 3 (1.03%) UiPath
8 2 (0.69%) Atlassian
8 2 (0.69%) Databricks
8 2 (0.69%) Remedy
9 1 (0.34%) Apple
9 1 (0.34%) Mercator
9 1 (0.34%) Qualys
9 1 (0.34%) Sage
9 1 (0.34%) webMethods