Stakeholder Management Contracts with Hybrid/Remote/WFH Options

Stakeholder Management
UK > Work from Home

The table below provides summary statistics for remote or hybrid contract work requiring Stakeholder Management skills. It includes a benchmarking guide to the contractor rates offered in vacancies that cited Stakeholder Management over the 6 months leading up to 30 April 2025, comparing them to the same period in the previous two years.

6 months to
30 Apr 2025
Same period 2024 Same period 2023
Rank 20 24 21
Rank change year-on-year +4 -3 -4
Contract jobs citing Stakeholder Management 927 1,146 2,084
As % of all contract jobs with a WFH option 9.35% 7.45% 8.06%
As % of the Processes & Methodologies category 10.27% 8.49% 8.97%
Number of daily rates quoted 653 810 1,519
10th Percentile £358 £362 £375
25th Percentile £430 £450 £450
Median daily rate (50th Percentile) £525 £526 £533
Median % change year-on-year -0.14% -1.36% +1.52%
75th Percentile £625 £638 £650
90th Percentile £738 £739 £736
UK median daily rate £525 £538 £550
% change year-on-year -2.33% -2.27% +4.76%
Number of hourly rates quoted 29 26 38
10th Percentile £35.00 £18.67 £19.43
25th Percentile £41.25 £30.16 £30.70
Median hourly rate £60.00 £60.00 £55.00
Median % change year-on-year - +9.09% +22.22%
75th Percentile £75.00 £77.29 £74.38
90th Percentile £75.75 £86.40 £84.24
UK median hourly rate £60.00 £60.00 £56.30
% change year-on-year - +6.57% +36.48%

All Process and Methodology Skills
Work from Home

Stakeholder Management falls under the Processes and Methodologies category. For comparison with the information above, the following table provides summary statistics for all contract job vacancies with remote or hybrid options requiring process or methodology skills.

Contract vacancies with a requirement for process or methodology skills 9,023 13,505 23,232
As % of all contract jobs with a WFH option 91.03% 87.83% 89.84%
Number of daily rates quoted 6,195 9,015 16,421
10th Percentile £340 £325 £363
25th Percentile £419 £425 £450
Median daily rate (50th Percentile) £525 £525 £540
Median % change year-on-year - -2.78% +2.86%
75th Percentile £638 £638 £650
90th Percentile £763 £750 £750
UK median daily rate £521 £525 £550
% change year-on-year -0.86% -4.55% +4.76%
Number of hourly rates quoted 225 573 532
10th Percentile £14.20 £15.17 £19.00
25th Percentile £19.75 £24.25 £30.54
Median hourly rate £40.00 £42.50 £55.00
Median % change year-on-year -5.88% -22.73% +57.14%
75th Percentile £67.50 £60.00 £68.75
90th Percentile £75.00 £75.25 £80.23
UK median hourly rate £29.00 £35.50 £37.30
% change year-on-year -18.31% -4.83% +49.20%

Stakeholder Management
Trend for Jobs with a WFH Option

Job vacancies with remote working options citing Stakeholder Management as a proportion of all IT jobs advertised.
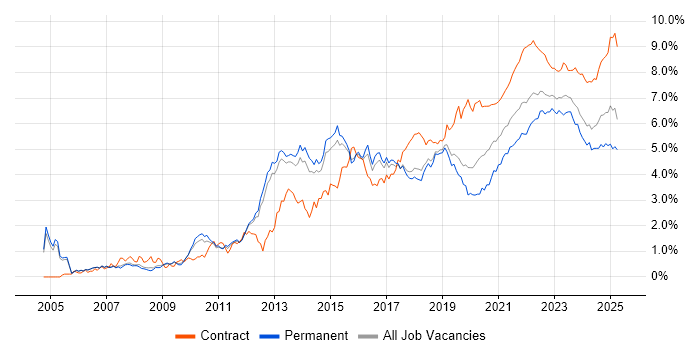
Stakeholder Management trend for jobs with Hybrid/Remote/WFH options

Stakeholder Management
Daily Rate Trend for Jobs with a WFH Option

3-month moving average daily rate quoted in job vacancies with remote working options citing Stakeholder Management.

Stakeholder Management daily rate for jobs with a WFH option

Stakeholder Management
Daily Rate Histogram for Jobs with a WFH Option

Daily rate distribution for jobs with remote working options citing Stakeholder Management over the 6 months to 30 April 2025.

Stakeholder Management daily rate histogram for jobs with a WFH option

Stakeholder Management
Hourly Rate Trend for Jobs with a WFH Option

3-month moving average hourly rate quoted in job vacancies with remote working options citing Stakeholder Management.

Stakeholder Management hourly rate for jobs with a WFH option

Stakeholder Management
Hourly Rate Histogram for Jobs with a WFH Option

Hourly rate distribution for jobs with remote working options citing Stakeholder Management over the 6 months to 30 April 2025.

Stakeholder Management hourly rate histogram for jobs with a WFH option

Stakeholder Management
Co-occurring Skills and Capabilities with WFH Options by Category

The follow tables expand on the table above by listing co-occurrences grouped by category. The same employment type, locality and period is covered with up to 20 co-occurrences shown in each of the following categories:

Application Platforms
1 44 (4.75%) Confluence
2 20 (2.16%) SharePoint
3 11 (1.19%) Apache Spark
4 9 (0.97%) CMS
5 3 (0.32%) Microsoft Exchange
5 3 (0.32%) SAS
6 2 (0.22%) Apache
6 2 (0.22%) ArcGIS
6 2 (0.22%) Headless CMS
6 2 (0.22%) JBoss
6 2 (0.22%) WebSphere
6 2 (0.22%) WebSphere Application Server
7 1 (0.11%) BizTalk Server
7 1 (0.11%) IIS
7 1 (0.11%) MTS
7 1 (0.11%) ThingWorx
7 1 (0.11%) WordPress
Applications
1 31 (3.34%) Microsoft Office
2 25 (2.70%) Microsoft Excel
2 25 (2.70%) MS Visio
3 22 (2.37%) Microsoft Project
4 21 (2.27%) Microsoft PowerPoint
5 13 (1.40%) Trello
6 3 (0.32%) Spreadsheet
7 2 (0.22%) Chatbot
8 1 (0.11%) Adobe XD
8 1 (0.11%) InVision
8 1 (0.11%) Sketch
8 1 (0.11%) UserZoom
Business Applications
1 38 (4.10%) SAP S/4HANA
2 11 (1.19%) Dynamics CRM
3 7 (0.76%) SAP MDG
4 6 (0.65%) SAP Oil and Gas
5 5 (0.54%) SAP FI
5 5 (0.54%) SAP Retail
6 4 (0.43%) SAP CAR
6 4 (0.43%) SAP CO
6 4 (0.43%) SAP FI/CO
6 4 (0.43%) SAP MM
7 3 (0.32%) Oracle EBS
7 3 (0.32%) Primavera
7 3 (0.32%) SAP SCM
7 3 (0.32%) SAP WM
8 2 (0.22%) Loan IQ
8 2 (0.22%) OPENHousing
8 2 (0.22%) SAP HR
8 2 (0.22%) SAP Payroll
8 2 (0.22%) SAP SD
8 2 (0.22%) Teamcenter
Cloud Services
1 121 (13.05%) Azure
2 93 (10.03%) AWS
3 49 (5.29%) Power Platform
4 30 (3.24%) GCP
5 26 (2.80%) Azure DevOps
5 26 (2.80%) Microsoft 365
6 24 (2.59%) SaaS
7 22 (2.37%) Serverless
8 21 (2.27%) Amazon S3
9 20 (2.16%) Amazon EKS
10 19 (2.05%) AWS CloudFormation
10 19 (2.05%) AWS Lambda
11 17 (1.83%) Dynamics 365
12 11 (1.19%) PowerApps
12 11 (1.19%) Snowflake
13 8 (0.86%) GitHub
14 7 (0.76%) Google Kubernetes Engine
14 7 (0.76%) Power Automate
14 7 (0.76%) Salesforce Service Cloud
15 6 (0.65%) Microsoft Purview
Communications & Networking
1 9 (0.97%) Firewall
1 9 (0.97%) SD-WAN
2 7 (0.76%) WAN
3 5 (0.54%) 5G
3 5 (0.54%) Intrusion Detection
4 4 (0.43%) BGP
4 4 (0.43%) Network Security
4 4 (0.43%) VPN
5 3 (0.32%) HTTP
5 3 (0.32%) LAN
5 3 (0.32%) MPLS
5 3 (0.32%) Wi-Fi
6 2 (0.22%) 4G
6 2 (0.22%) Cisco ISE
6 2 (0.22%) Ethernet
6 2 (0.22%) OSPF
6 2 (0.22%) SDH
6 2 (0.22%) Software-Defined Networking
6 2 (0.22%) TCP/IP
7 1 (0.11%) Cisco Nexus
Database & Business Intelligence
1 37 (3.99%) Power BI
2 20 (2.16%) Amazon RDS
2 20 (2.16%) Data Warehouse
3 18 (1.94%) Big Data
4 15 (1.62%) Data Lake
5 12 (1.29%) PostgreSQL
6 10 (1.08%) Tableau
7 9 (0.97%) Hadoop
7 9 (0.97%) SQL Server
8 8 (0.86%) Metadata
9 7 (0.76%) Elasticsearch
10 5 (0.54%) Amazon Redshift
10 5 (0.54%) NoSQL
10 5 (0.54%) Relational Database
11 4 (0.43%) GIS
11 4 (0.43%) RDBMS
12 3 (0.32%) Looker
12 3 (0.32%) SQL Server Integration Services
12 3 (0.32%) SQL Server Reporting Services
13 2 (0.22%) Amazon QuickSight
Development Applications
1 95 (10.25%) JIRA
2 14 (1.51%) Jenkins
3 12 (1.29%) JMeter
4 9 (0.97%) ERwin
5 7 (0.76%) Git
5 7 (0.76%) GitLab
5 7 (0.76%) Selenium
6 6 (0.65%) LoadRunner
7 5 (0.54%) Cypress.io
7 5 (0.54%) NeoLoad
8 4 (0.43%) Appium
8 4 (0.43%) CircleCI
8 4 (0.43%) ER Studio
8 4 (0.43%) Gatling
8 4 (0.43%) Serenity BDD
8 4 (0.43%) SpecFlow
9 2 (0.22%) MLflow
9 2 (0.22%) Postman
9 2 (0.22%) TeamCity
9 2 (0.22%) WebDriver
General
1 453 (48.87%) Social Skills
2 256 (27.62%) Finance
3 161 (17.37%) Analytical Skills
4 120 (12.94%) Public Sector
5 70 (7.55%) Banking
6 42 (4.53%) Retail
7 38 (4.10%) Presentation Skills
8 37 (3.99%) Influencing Skills
9 34 (3.67%) Legal
10 31 (3.34%) Marketing
11 29 (3.13%) Organisational Skills
12 28 (3.02%) Manufacturing
13 23 (2.48%) Pharmaceutical
14 22 (2.37%) Inclusion and Diversity
15 16 (1.73%) Local Government
16 14 (1.51%) Telecoms
17 10 (1.08%) Advertising
17 10 (1.08%) Automotive
17 10 (1.08%) Documentation Skills
17 10 (1.08%) Law
Job Titles
1 152 (16.40%) Analyst
2 142 (15.32%) Project Manager
3 132 (14.24%) Architect
4 92 (9.92%) Business Analyst
5 88 (9.49%) Lead
6 78 (8.41%) Senior
7 58 (6.26%) Consultant
8 47 (5.07%) Programme Manager
9 36 (3.88%) IT Manager
9 36 (3.88%) Solutions Architect
10 27 (2.91%) Data Analyst
10 27 (2.91%) Senior Manager
11 24 (2.59%) Delivery Manager
11 24 (2.59%) Developer
12 23 (2.48%) Change Manager
13 19 (2.05%) AWS Architect
13 19 (2.05%) IT Project Manager
13 19 (2.05%) SAP Consultant
14 18 (1.94%) Technical Manager
15 17 (1.83%) Security Manager
Libraries, Frameworks & Software Standards
1 12 (1.29%) React
2 11 (1.19%) .NET
2 11 (1.19%) Oracle Fusion
3 7 (0.76%) OpenTelemetry
4 6 (0.65%) HTML
4 6 (0.65%) Middleware
5 5 (0.54%) CSS
5 5 (0.54%) Kafka
5 5 (0.54%) Node.js
5 5 (0.54%) REST
5 5 (0.54%) SailPoint
5 5 (0.54%) SOAP
6 4 (0.43%) AngularJS
6 4 (0.43%) Play Framework
6 4 (0.43%) Playwright
6 4 (0.43%) XML
7 3 (0.32%) .NET Core
7 3 (0.32%) SAML
7 3 (0.32%) Web Services
7 3 (0.32%) XSLT
Miscellaneous
1 48 (5.18%) Management Information System
2 45 (4.85%) Product Ownership
3 24 (2.59%) Onboarding
4 23 (2.48%) Data Protection Act
4 23 (2.48%) Operational Technology
5 20 (2.16%) Legacy Systems
6 16 (1.73%) Data Centre
7 15 (1.62%) PMI
8 14 (1.51%) Life Science
9 10 (1.08%) Data Structures
9 10 (1.08%) FMCG
9 10 (1.08%) Renewable Energy
10 9 (0.97%) Analytical Mindset
11 8 (0.86%) Greenfield Project
12 7 (0.76%) Self-Motivation
13 6 (0.65%) Cloud Native
13 6 (0.65%) NHS
13 6 (0.65%) Security Posture
14 5 (0.54%) Mobile App
14 5 (0.54%) SCADA
Operating Systems
1 22 (2.37%) Windows
2 19 (2.05%) Linux
3 8 (0.86%) Red Hat Enterprise Linux
4 7 (0.76%) Windows Server
5 6 (0.65%) Unix
6 3 (0.32%) Apple iOS
6 3 (0.32%) Mac OS
6 3 (0.32%) Windows 10
7 2 (0.22%) Android
7 2 (0.22%) Windows 7
7 2 (0.22%) Windows XP
8 1 (0.11%) Amazon Linux
8 1 (0.11%) zOS
Processes & Methodologies
1 294 (31.72%) Agile
2 212 (22.87%) Problem-Solving
3 203 (21.90%) Project Management
4 108 (11.65%) Project Delivery
5 96 (10.36%) Migration
6 91 (9.82%) Roadmaps
7 90 (9.71%) Change Management
8 89 (9.60%) Risk Management
9 82 (8.85%) Analytics
10 79 (8.52%) Stakeholder Engagement
11 77 (8.31%) Decision-Making
12 75 (8.09%) Continuous Improvement
13 74 (7.98%) DevOps
14 71 (7.66%) Waterfall
15 62 (6.69%) Process Improvement
15 62 (6.69%) Scrum
16 58 (6.26%) Business Analysis
17 57 (6.15%) Data Analysis
18 54 (5.83%) PRINCE2
19 51 (5.50%) Data Modelling
Programming Languages
1 66 (7.12%) SQL
2 49 (5.29%) Python
3 29 (3.13%) JavaScript
4 27 (2.91%) Java
5 15 (1.62%) C#
5 15 (1.62%) PHP
6 10 (1.08%) PowerShell
7 9 (0.97%) TypeScript
8 6 (0.65%) C++
9 5 (0.54%) R
10 4 (0.43%) ABAP
10 4 (0.43%) Bash
10 4 (0.43%) PL/SQL
10 4 (0.43%) Ruby
10 4 (0.43%) Scala
11 3 (0.32%) REXX
12 2 (0.22%) Shell Script
12 2 (0.22%) VB
12 2 (0.22%) VBA
12 2 (0.22%) VBScript
Qualifications
1 131 (14.13%) Security Cleared
2 121 (13.05%) SC Cleared
3 96 (10.36%) Degree
4 49 (5.29%) PMP
5 48 (5.18%) PMI Certification
6 20 (2.16%) AWS Certification
7 18 (1.94%) AWS Certified Solutions Architect
8 17 (1.83%) Computer Science Degree
9 15 (1.62%) Master's Degree
10 14 (1.51%) CISSP
11 11 (1.19%) CISA
12 10 (1.08%) CISM
13 8 (0.86%) BPSS Clearance
13 8 (0.86%) Microsoft Certification
14 7 (0.76%) ITIL Certification
15 6 (0.65%) DBS Check
15 6 (0.65%) ISTQB
16 5 (0.54%) Azure Certification
16 5 (0.54%) Cisco Certification
17 4 (0.43%) SAP Certification
Quality Assurance & Compliance
1 53 (5.72%) QA
2 44 (4.75%) PMO
3 40 (4.31%) Data Quality
4 28 (3.02%) Accessibility
5 23 (2.48%) NIST
6 22 (2.37%) ISO/IEC 27001
7 21 (2.27%) GDPR
8 12 (1.29%) Sarbanes-Oxley
9 8 (0.86%) HIPAA
10 7 (0.76%) COBIT
11 6 (0.65%) PCI DSS
12 5 (0.54%) GRC
13 4 (0.43%) COSO
13 4 (0.43%) MiFID
13 4 (0.43%) NCSC
14 3 (0.32%) Actionable Recommendations
14 3 (0.32%) ISO/IEC 27005
14 3 (0.32%) NIST 800
14 3 (0.32%) SLA
14 3 (0.32%) WCAG
System Software
1 11 (1.19%) Active Directory
1 11 (1.19%) VMware Infrastructure
2 8 (0.86%) Docker
3 3 (0.32%) Virtual Machines
4 1 (0.11%) Firmware
4 1 (0.11%) HDFS
4 1 (0.11%) Microcode
4 1 (0.11%) NFS
4 1 (0.11%) OpenAM
4 1 (0.11%) OpenDJ
4 1 (0.11%) OpenIDM
4 1 (0.11%) Time Sharing Option
4 1 (0.11%) Virtual Desktop
4 1 (0.11%) VMware NSX
Systems Management
1 21 (2.27%) Kubernetes
1 21 (2.27%) Terraform
2 15 (1.62%) Ansible
3 9 (0.97%) Grafana
4 7 (0.76%) Argo
5 4 (0.43%) Microsoft Intune
5 4 (0.43%) Perfmon
5 4 (0.43%) SCCM
6 3 (0.32%) Amdocs OSS
7 2 (0.22%) CSIRT
7 2 (0.22%) Packer
7 2 (0.22%) SCOM
7 2 (0.22%) Single Sign-On
8 1 (0.11%) CASB
8 1 (0.11%) HP ALM
8 1 (0.11%) HP Quality Center
8 1 (0.11%) Plesk
8 1 (0.11%) Progress Chef
8 1 (0.11%) Prometheus
8 1 (0.11%) Tivoli Storage Manager
Vendors
1 102 (11.00%) Microsoft
2 89 (9.60%) SAP
3 31 (3.34%) Oracle
4 24 (2.59%) ServiceNow
5 21 (2.27%) Salesforce
6 20 (2.16%) Databricks
7 19 (2.05%) Ariba
8 14 (1.51%) VMware
9 11 (1.19%) Google
10 10 (1.08%) Cisco
10 10 (1.08%) Workday
11 7 (0.76%) Dynatrace
12 6 (0.65%) Atlassian
12 6 (0.65%) IBM
12 6 (0.65%) New Relic
13 5 (0.54%) Adobe
13 5 (0.54%) Planview
14 4 (0.43%) Cognos
14 4 (0.43%) CyberArk
14 4 (0.43%) Pega