Data Analysis Contracts with Hybrid/Remote/WFH Options

Data Analysis
UK > Work from Home

The table below provides summary statistics for remote or hybrid contract work requiring Data Analysis skills. It includes a benchmarking guide to the contractor rates offered in vacancies that cited Data Analysis over the 6 months leading up to 1 May 2025, comparing them to the same period in the previous two years.

6 months to
1 May 2025
Same period 2024 Same period 2023
Rank 73 82 120
Rank change year-on-year +9 +38 -3
Contract jobs citing Data Analysis 319 385 515
As % of all contract jobs with a WFH option 3.22% 2.51% 1.99%
As % of the Processes & Methodologies category 3.54% 2.86% 2.22%
Number of daily rates quoted 192 246 387
10th Percentile £263 £345 £312
25th Percentile £374 £405 £400
Median daily rate (50th Percentile) £475 £500 £475
Median % change year-on-year -5.00% +5.26% -5.00%
75th Percentile £550 £588 £575
90th Percentile £650 £666 £650
UK median daily rate £475 £500 £500
% change year-on-year -5.00% - -1.57%
Number of hourly rates quoted 10 13 6
10th Percentile £21.25 - £18.91
25th Percentile £21.44 £20.77 £20.08
Median hourly rate £22.00 £24.26 £23.15
Median % change year-on-year -9.30% +4.77% -36.38%
75th Percentile £33.51 £31.13 £32.04
90th Percentile £35.14 £35.50 £48.75
UK median hourly rate £29.07 £29.00 £33.65
% change year-on-year +0.24% -13.82% -3.86%

All Process and Methodology Skills
Work from Home

Data Analysis falls under the Processes and Methodologies category. For comparison with the information above, the following table provides summary statistics for all contract job vacancies with remote or hybrid options requiring process or methodology skills.

Contract vacancies with a requirement for process or methodology skills 9,021 13,483 23,229
As % of all contract jobs with a WFH option 91.08% 87.87% 89.84%
Number of daily rates quoted 6,191 8,996 16,418
10th Percentile £340 £325 £363
25th Percentile £419 £425 £450
Median daily rate (50th Percentile) £525 £525 £540
Median % change year-on-year - -2.78% +2.86%
75th Percentile £638 £638 £650
90th Percentile £763 £750 £750
UK median daily rate £520 £525 £550
% change year-on-year -0.95% -4.55% +4.76%
Number of hourly rates quoted 224 579 532
10th Percentile £14.20 £15.17 £19.00
25th Percentile £19.56 £25.25 £30.54
Median hourly rate £39.52 £43.00 £55.00
Median % change year-on-year -8.09% -21.82% +57.14%
75th Percentile £66.13 £60.00 £68.75
90th Percentile £75.00 £75.25 £80.23
UK median hourly rate £29.00 £35.65 £37.30
% change year-on-year -18.65% -4.42% +49.20%

Data Analysis
Trend for Jobs with a WFH Option

Job vacancies with remote working options citing Data Analysis as a proportion of all IT jobs advertised.
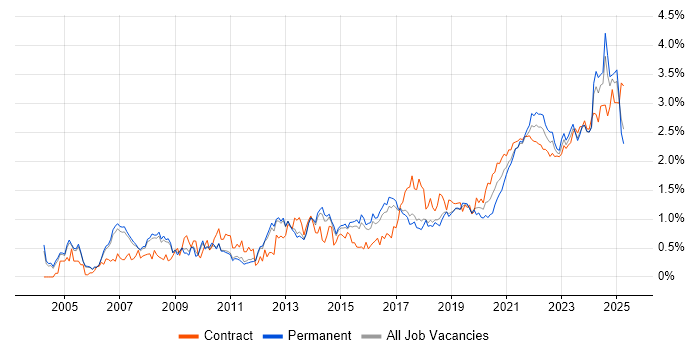
Data Analysis trend for jobs with Hybrid/Remote/WFH options

Data Analysis
Daily Rate Trend for Jobs with a WFH Option

3-month moving average daily rate quoted in job vacancies with remote working options citing Data Analysis.

Data Analysis daily rate for jobs with a WFH option

Data Analysis
Daily Rate Histogram for Jobs with a WFH Option

Daily rate distribution for jobs with remote working options citing Data Analysis over the 6 months to 1 May 2025.

Data Analysis daily rate histogram for jobs with a WFH option

Data Analysis
Hourly Rate Trend for Jobs with a WFH Option

3-month moving average hourly rate quoted in job vacancies with remote working options citing Data Analysis.

Data Analysis hourly rate for jobs with a WFH option

Data Analysis
Hourly Rate Histogram for Jobs with a WFH Option

Hourly rate distribution for jobs with remote working options citing Data Analysis over the 6 months to 1 May 2025.

Data Analysis hourly rate histogram for jobs with a WFH option

Data Analysis
Co-occurring Skills and Capabilities with WFH Options by Category

The follow tables expand on the table above by listing co-occurrences grouped by category. The same employment type, locality and period is covered with up to 20 co-occurrences shown in each of the following categories:

Application Platforms
1 13 (4.08%) Confluence
2 11 (3.45%) SharePoint
3 10 (3.13%) SAS
4 9 (2.82%) Apache Spark
5 3 (0.94%) Jupyter
6 2 (0.63%) Apache Airflow
6 2 (0.63%) ArcGIS
7 1 (0.31%) Camunda
7 1 (0.31%) CMS
7 1 (0.31%) Drupal
7 1 (0.31%) IBM Domino
7 1 (0.31%) IIS
7 1 (0.31%) Microsoft Exchange
Applications
1 51 (15.99%) Microsoft Excel
2 14 (4.39%) Microsoft PowerPoint
3 12 (3.76%) MS Visio
4 10 (3.13%) Microsoft Office
5 5 (1.57%) Microsoft Project
6 3 (0.94%) Spreadsheet
7 1 (0.31%) Adobe XD
7 1 (0.31%) Notepad++
7 1 (0.31%) Trello
Business Applications
1 10 (3.13%) Dynamics CRM
2 5 (1.57%) Workday HCM
3 3 (0.94%) SAP HR
3 3 (0.94%) Sparx Enterprise Architect
4 2 (0.63%) Actimize
4 2 (0.63%) Oracle ERP
4 2 (0.63%) SAP S/4HANA
5 1 (0.31%) Oracle Applications
5 1 (0.31%) Oracle EBS
5 1 (0.31%) Oracle EBS R12
5 1 (0.31%) Payment Gateway
5 1 (0.31%) Primavera
5 1 (0.31%) Remedy ITSM
5 1 (0.31%) SAP ERP
5 1 (0.31%) SAP EWM
5 1 (0.31%) SAP GTS
5 1 (0.31%) Summit
Cloud Services
1 72 (22.57%) Power Platform
2 32 (10.03%) Azure
3 25 (7.84%) AWS
4 15 (4.70%) GCP
5 10 (3.13%) Snowflake
6 9 (2.82%) Dynamics 365
7 5 (1.57%) Azure DevOps
7 5 (1.57%) Azure Machine Learning
7 5 (1.57%) SaaS
8 4 (1.25%) Power Automate
8 4 (1.25%) PowerApps
8 4 (1.25%) SuccessFactors
9 3 (0.94%) Azure Data Factory
10 2 (0.63%) Amazon SageMaker
10 2 (0.63%) Cloud Composer
10 2 (0.63%) Cloud Computing
10 2 (0.63%) Cloud Functions
10 2 (0.63%) Google Analytics
10 2 (0.63%) Microsoft 365
10 2 (0.63%) Vertex AI
Communications & Networking
1 2 (0.63%) HTTP
1 2 (0.63%) Intrusion Detection
1 2 (0.63%) POP3
1 2 (0.63%) SMTP
2 1 (0.31%) Internet
Database & Business Intelligence
1 72 (22.57%) Power BI
2 45 (14.11%) Tableau
3 29 (9.09%) Data Warehouse
4 17 (5.33%) SQL Server
5 15 (4.70%) Relational Database
6 12 (3.76%) SQL Server Reporting Services
7 11 (3.45%) Looker
8 9 (2.82%) SQL Server Integration Services
9 8 (2.51%) Data Mining
9 8 (2.51%) MS Access
10 7 (2.19%) BigQuery
10 7 (2.19%) Data Lake
10 7 (2.19%) NoSQL
11 5 (1.57%) BusinessObjects
11 5 (1.57%) Oracle Reports
12 4 (1.25%) Big Data
12 4 (1.25%) Power Query
12 4 (1.25%) SQL Server Analysis Services
13 3 (0.94%) Hadoop
13 3 (0.94%) SAP Data Services
Development Applications
1 27 (8.46%) JIRA
2 6 (1.88%) Git
3 3 (0.94%) ERwin
4 2 (0.63%) Postman
4 2 (0.63%) Visual Studio
5 1 (0.31%) GitLab
5 1 (0.31%) Jenkins
5 1 (0.31%) MagicDraw
5 1 (0.31%) MLflow
5 1 (0.31%) Octopus Deploy
5 1 (0.31%) Rational Rhapsody
5 1 (0.31%) XMLSpy
General
1 117 (36.68%) Social Skills
2 109 (34.17%) Analytical Skills
3 80 (25.08%) Finance
4 42 (13.17%) Public Sector
5 40 (12.54%) Banking
6 29 (9.09%) Marketing
7 17 (5.33%) Retail
8 14 (4.39%) Organisational Skills
8 14 (4.39%) Presentation Skills
9 13 (4.08%) Inclusion and Diversity
10 12 (3.76%) Investment Banking
10 12 (3.76%) Telecoms
11 7 (2.19%) Front Office
11 7 (2.19%) Manufacturing
12 6 (1.88%) Pharmaceutical
13 5 (1.57%) Billing
13 5 (1.57%) Financial Institution
13 5 (1.57%) Influencing Skills
14 4 (1.25%) Military
14 4 (1.25%) Retail Banking
Job Titles
1 149 (46.71%) Analyst
2 75 (23.51%) Data Analyst
3 59 (18.50%) Business Analyst
4 26 (8.15%) Developer
5 23 (7.21%) Data Scientist
6 15 (4.70%) Consultant
7 14 (4.39%) Data Business Analyst
8 13 (4.08%) IT Manager
9 11 (3.45%) Junior
9 11 (3.45%) Lead
10 10 (3.13%) Architect
10 10 (3.13%) Data Engineer
11 9 (2.82%) Report Analyst
11 9 (2.82%) Security Analyst
12 8 (2.51%) Junior Analyst
12 8 (2.51%) Senior
13 7 (2.19%) Junior Data Analyst
13 7 (2.19%) Senior Analyst
14 6 (1.88%) Credit Analyst
14 6 (1.88%) Operations Manager
Libraries, Frameworks & Software Standards
1 13 (4.08%) REST
1 13 (4.08%) SOAP
2 12 (3.76%) Web Services
3 5 (1.57%) JSON
4 4 (1.25%) .NET
4 4 (1.25%) CSS
4 4 (1.25%) HTML
4 4 (1.25%) Matplotlib
4 4 (1.25%) Pandas
4 4 (1.25%) Plotly
4 4 (1.25%) scikit-learn
4 4 (1.25%) XML
5 3 (0.94%) Oracle Fusion
6 2 (0.63%) AngularJS
6 2 (0.63%) Bootstrap
6 2 (0.63%) CSS3
6 2 (0.63%) Kafka
6 2 (0.63%) LDAP
6 2 (0.63%) NumPy
6 2 (0.63%) React
Miscellaneous
1 20 (6.27%) Data Structures
2 13 (4.08%) Algorithms
3 11 (3.45%) Product Ownership
4 9 (2.82%) Derivative
5 8 (2.51%) Management Information System
6 7 (2.19%) Legacy Systems
7 6 (1.88%) Data Protection Act
7 6 (1.88%) Foreign Exchange (FX)
7 6 (1.88%) IoT
7 6 (1.88%) Multi-touch
8 5 (1.57%) Credit Risk
8 5 (1.57%) Fixed Income
8 5 (1.57%) Security Posture
9 4 (1.25%) Cyber Security Posture
9 4 (1.25%) Equities
10 3 (0.94%) Analytical Mindset
10 3 (0.94%) Onboarding
10 3 (0.94%) Operational Technology
11 2 (0.63%) OTC Derivatives
11 2 (0.63%) Self-Motivation
Operating Systems
1 4 (1.25%) Linux
2 3 (0.94%) Windows
3 1 (0.31%) Unix
3 1 (0.31%) Windows Server
Processes & Methodologies
1 81 (25.39%) Decision-Making
2 80 (25.08%) Problem-Solving
3 74 (23.20%) Business Intelligence
4 66 (20.69%) Visualisation
5 57 (17.87%) Stakeholder Management
6 56 (17.55%) Analytics
7 52 (16.30%) Agile
8 44 (13.79%) Data Modelling
9 41 (12.85%) Data Visualisation
10 40 (12.54%) Actionable Insight
11 39 (12.23%) Project Management
12 37 (11.60%) Data Governance
13 36 (11.29%) Data Science
13 36 (11.29%) Machine Learning
14 33 (10.34%) Requirements Gathering
15 32 (10.03%) Migration
16 30 (9.40%) ETL
17 26 (8.15%) Process Improvement
18 25 (7.84%) Business Analysis
18 25 (7.84%) Statistics
Programming Languages
1 131 (41.07%) SQL
2 69 (21.63%) Python
3 16 (5.02%) R
4 12 (3.76%) C#
4 12 (3.76%) JavaScript
4 12 (3.76%) PowerShell
5 6 (1.88%) Data Analysis Expressions
5 6 (1.88%) T-SQL
6 3 (0.94%) C++
7 2 (0.63%) PHP
7 2 (0.63%) VB
8 1 (0.31%) ABAP
8 1 (0.31%) Bash
8 1 (0.31%) C
8 1 (0.31%) Java
8 1 (0.31%) MATLAB
8 1 (0.31%) Perl
8 1 (0.31%) Shell Script
8 1 (0.31%) VB.NET
8 1 (0.31%) VB6
Qualifications
1 53 (16.61%) Degree
2 32 (10.03%) Security Cleared
3 31 (9.72%) SC Cleared
4 10 (3.13%) Master's Degree
5 6 (1.88%) Numerate Degree
6 4 (1.25%) Computer Science Degree
6 4 (1.25%) Microsoft Certification
7 3 (0.94%) CFA
7 3 (0.94%) PhD
7 3 (0.94%) PMI Certification
7 3 (0.94%) PMP
8 2 (0.63%) BPSS Clearance
8 2 (0.63%) CBAP
8 2 (0.63%) MBA
9 1 (0.31%) AWS Certification
9 1 (0.31%) DV Cleared
9 1 (0.31%) GCIH
9 1 (0.31%) ISTQB
9 1 (0.31%) SnowPro
9 1 (0.31%) Tableau Certification
Quality Assurance & Compliance
1 42 (13.17%) Data Quality
2 18 (5.64%) QA
3 17 (5.33%) Accessibility
4 14 (4.39%) GDPR
5 7 (2.19%) ISO/IEC 27001
6 6 (1.88%) Actionable Recommendations
6 6 (1.88%) PMO
7 5 (1.57%) EMIR
7 5 (1.57%) MiFID
8 3 (0.94%) Disclosure Scotland
8 3 (0.94%) NIST
9 2 (0.63%) COREP
9 2 (0.63%) Dodd-Frank
9 2 (0.63%) FINREP
10 1 (0.31%) Basel III
10 1 (0.31%) HIPAA
10 1 (0.31%) HL7
10 1 (0.31%) PCI DSS
10 1 (0.31%) SNOMED CT
10 1 (0.31%) WCAG
System Software
1 3 (0.94%) Active Directory
2 1 (0.31%) Docker
2 1 (0.31%) Virtual Machines
Systems Management
1 2 (0.63%) Single Sign-On
2 1 (0.31%) Kubernetes
2 1 (0.31%) Terraform
Vendors
1 36 (11.29%) Microsoft
2 18 (5.64%) Oracle
3 16 (5.02%) Google
4 12 (3.76%) SAP
4 12 (3.76%) ServiceNow
5 10 (3.13%) Databricks
6 8 (2.51%) Workday
7 7 (2.19%) Splunk
8 5 (1.57%) Salesforce
9 4 (1.25%) Dynatrace
9 4 (1.25%) Foundry
10 3 (0.94%) Alteryx
10 3 (0.94%) Sparx
10 3 (0.94%) UiPath
11 2 (0.63%) Adobe
11 2 (0.63%) Charles River
11 2 (0.63%) Murex
12 1 (0.31%) Calypso
12 1 (0.31%) Citrix
12 1 (0.31%) Dell