Decision-Making Contracts with Hybrid/Remote/WFH Options

Decision-Making
UK > Work from Home

The table below provides summary statistics for remote or hybrid contract work requiring Decision-Making skills. It includes a benchmarking guide to the contractor rates offered in vacancies that cited Decision-Making over the 6 months leading up to 1 May 2025, comparing them to the same period in the previous two years.

6 months to
1 May 2025
Same period 2024 Same period 2023
Rank 50 62 96
Rank change year-on-year +12 +34 -17
Contract jobs citing Decision-Making 404 478 633
As % of all contract jobs with a WFH option 4.08% 3.12% 2.45%
As % of the Processes & Methodologies category 4.48% 3.55% 2.73%
Number of daily rates quoted 244 330 440
10th Percentile £312 £313 £349
25th Percentile £400 £421 £450
Median daily rate (50th Percentile) £500 £525 £525
Median % change year-on-year -4.76% - -
75th Percentile £606 £625 £632
90th Percentile £725 £712 £713
UK median daily rate £519 £525 £525
% change year-on-year -1.19% - -2.78%
Number of hourly rates quoted 12 25 22
10th Percentile £18.90 £24.22 £17.18
25th Percentile £22.66 £27.81 £19.00
Median hourly rate £30.40 £35.00 £22.16
Median % change year-on-year -13.14% +57.94% -47.86%
75th Percentile £42.03 £43.75 £36.88
90th Percentile £71.15 £51.50 £55.55
UK median hourly rate £31.08 £19.38 £47.50
% change year-on-year +60.39% -59.21% +11.76%

All Process and Methodology Skills
Work from Home

Decision-Making falls under the Processes and Methodologies category. For comparison with the information above, the following table provides summary statistics for all contract job vacancies with remote or hybrid options requiring process or methodology skills.

Contract vacancies with a requirement for process or methodology skills 9,021 13,483 23,229
As % of all contract jobs with a WFH option 91.08% 87.87% 89.84%
Number of daily rates quoted 6,191 8,996 16,418
10th Percentile £340 £325 £363
25th Percentile £419 £425 £450
Median daily rate (50th Percentile) £525 £525 £540
Median % change year-on-year - -2.78% +2.86%
75th Percentile £638 £638 £650
90th Percentile £763 £750 £750
UK median daily rate £520 £525 £550
% change year-on-year -0.95% -4.55% +4.76%
Number of hourly rates quoted 224 579 532
10th Percentile £14.20 £15.17 £19.00
25th Percentile £19.56 £25.25 £30.54
Median hourly rate £39.52 £43.00 £55.00
Median % change year-on-year -8.09% -21.82% +57.14%
75th Percentile £66.13 £60.00 £68.75
90th Percentile £75.00 £75.25 £80.23
UK median hourly rate £29.00 £35.65 £37.30
% change year-on-year -18.65% -4.42% +49.20%

Decision-Making
Trend for Jobs with a WFH Option

Job vacancies with remote working options citing Decision-Making as a proportion of all IT jobs advertised.
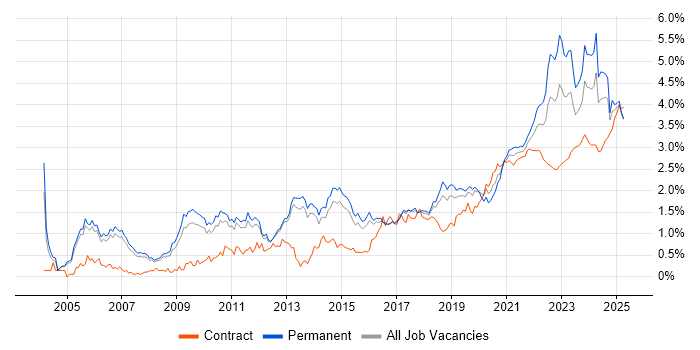
Decision-Making trend for jobs with Hybrid/Remote/WFH options

Decision-Making
Daily Rate Trend for Jobs with a WFH Option

3-month moving average daily rate quoted in job vacancies with remote working options citing Decision-Making.

Decision-Making daily rate for jobs with a WFH option

Decision-Making
Daily Rate Histogram for Jobs with a WFH Option

Daily rate distribution for jobs with remote working options citing Decision-Making over the 6 months to 1 May 2025.

Decision-Making daily rate histogram for jobs with a WFH option

Decision-Making
Hourly Rate Trend for Jobs with a WFH Option

3-month moving average hourly rate quoted in job vacancies with remote working options citing Decision-Making.

Decision-Making hourly rate for jobs with a WFH option

Decision-Making
Hourly Rate Histogram for Jobs with a WFH Option

Hourly rate distribution for jobs with remote working options citing Decision-Making over the 6 months to 1 May 2025.

Decision-Making hourly rate histogram for jobs with a WFH option

Decision-Making
Co-occurring Skills and Capabilities with WFH Options by Category

The follow tables expand on the table above by listing co-occurrences grouped by category. The same employment type, locality and period is covered with up to 20 co-occurrences shown in each of the following categories:

Application Platforms
1 17 (4.21%) Confluence
2 13 (3.22%) Apache Spark
3 8 (1.98%) CMS
4 7 (1.73%) Microsoft Exchange
5 4 (0.99%) Apache Airflow
5 4 (0.99%) Headless CMS
5 4 (0.99%) SharePoint
6 3 (0.74%) Apache
6 3 (0.74%) Exchange Server 2013
7 1 (0.25%) ArcGIS
7 1 (0.25%) Drupal
7 1 (0.25%) Jupyter
7 1 (0.25%) SAS
Applications
1 27 (6.68%) Microsoft Excel
2 23 (5.69%) Microsoft PowerPoint
3 18 (4.46%) Microsoft Office
4 15 (3.71%) MS Visio
5 8 (1.98%) Trello
6 7 (1.73%) Microsoft Project
7 3 (0.74%) Spreadsheet
8 2 (0.50%) Adobe XD
8 2 (0.50%) Sketch
9 1 (0.25%) Fusion 360
9 1 (0.25%) InfoPath
9 1 (0.25%) Siemens NX
Business Applications
1 13 (3.22%) SAP S/4HANA
2 8 (1.98%) Dynamics CRM
3 4 (0.99%) SAP EWM
4 3 (0.74%) Aladdin
5 2 (0.50%) Actimize
5 2 (0.50%) iTrent
5 2 (0.50%) Unit4 Business World
6 1 (0.25%) Dynamics AX
6 1 (0.25%) IBM Planning Analytics
6 1 (0.25%) Maximo
6 1 (0.25%) NEC Housing
6 1 (0.25%) Oracle EBS
6 1 (0.25%) Oracle Financials
6 1 (0.25%) Oracle Procure-to-Pay
6 1 (0.25%) PeopleSoft Financials
6 1 (0.25%) Primavera
6 1 (0.25%) Salesforce CRM
6 1 (0.25%) SAP WM
6 1 (0.25%) SimCorp Dimension
6 1 (0.25%) Teamcenter
Cloud Services
1 69 (17.08%) AWS
2 61 (15.10%) Azure
3 44 (10.89%) Power Platform
4 31 (7.67%) GCP
5 17 (4.21%) SaaS
5 17 (4.21%) Snowflake
6 11 (2.72%) Cloud Computing
6 11 (2.72%) Dynamics 365
7 10 (2.48%) Microsoft 365
8 8 (1.98%) PaaS
9 7 (1.73%) IaaS
10 5 (1.24%) dbt
10 5 (1.24%) Serverless
11 4 (0.99%) Amazon S3
11 4 (0.99%) Amazon SageMaker
11 4 (0.99%) GitHub
11 4 (0.99%) Mimecast
12 3 (0.74%) Azure Machine Learning
12 3 (0.74%) Entra ID
12 3 (0.74%) Google Analytics
Communications & Networking
1 5 (1.24%) Network Security
2 4 (0.99%) IPsec
2 4 (0.99%) SSL
2 4 (0.99%) TCP/IP
3 3 (0.74%) Firewall
3 3 (0.74%) Kerberos
3 3 (0.74%) Unified Communications
3 3 (0.74%) WAN
4 2 (0.50%) BGP
4 2 (0.50%) DHCP
4 2 (0.50%) DNS
4 2 (0.50%) Intrusion Detection
4 2 (0.50%) OSPF
4 2 (0.50%) VPN
5 1 (0.25%) EIGRP
5 1 (0.25%) Extranet
5 1 (0.25%) Intranet
5 1 (0.25%) LAN
5 1 (0.25%) VRRP
5 1 (0.25%) Wi-Fi
Database & Business Intelligence
1 43 (10.64%) Power BI
2 29 (7.18%) Tableau
3 27 (6.68%) Data Warehouse
4 11 (2.72%) MongoDB
5 10 (2.48%) Big Data
5 10 (2.48%) Looker
5 10 (2.48%) SQL Server
6 9 (2.23%) NoSQL
7 8 (1.98%) BigQuery
7 8 (1.98%) Data Lake
7 8 (1.98%) Hadoop
7 8 (1.98%) PostgreSQL
7 8 (1.98%) Relational Database
8 6 (1.49%) Amazon Redshift
8 6 (1.49%) SQL Server Reporting Services
9 5 (1.24%) Power Query
9 5 (1.24%) SQL Server Integration Services
10 4 (0.99%) GIS
10 4 (0.99%) Metadata
10 4 (0.99%) SQL Server Analysis Services
Development Applications
1 33 (8.17%) JIRA
2 4 (0.99%) GitLab
3 3 (0.74%) Maven
4 2 (0.50%) ERwin
4 2 (0.50%) Jenkins
4 2 (0.50%) Visual Studio
5 1 (0.25%) Cucumber
5 1 (0.25%) Cypress.io
5 1 (0.25%) Flyway
5 1 (0.25%) Git
5 1 (0.25%) JMeter
5 1 (0.25%) MLflow
5 1 (0.25%) PowerDesigner
5 1 (0.25%) REST Assured
5 1 (0.25%) Selenium
5 1 (0.25%) SonarQube
5 1 (0.25%) Terragrunt
General
1 184 (45.54%) Social Skills
2 123 (30.45%) Finance
3 100 (24.75%) Analytical Skills
4 44 (10.89%) Banking
4 44 (10.89%) Public Sector
5 26 (6.44%) Presentation Skills
6 22 (5.45%) Inclusion and Diversity
7 19 (4.70%) Investment Banking
8 18 (4.46%) Marketing
8 18 (4.46%) Retail
9 16 (3.96%) Influencing Skills
10 14 (3.47%) Manufacturing
10 14 (3.47%) Organisational Skills
11 10 (2.48%) Legal
11 10 (2.48%) Retail Banking
12 8 (1.98%) Tech for Good
13 7 (1.73%) Local Government
14 6 (1.49%) Automotive
14 6 (1.49%) Back Office
14 6 (1.49%) Corporate Banking
Job Titles
1 85 (21.04%) Analyst
2 45 (11.14%) Architect
2 45 (11.14%) Business Analyst
3 33 (8.17%) Developer
4 31 (7.67%) Data Analyst
4 31 (7.67%) Lead
5 27 (6.68%) Project Manager
5 27 (6.68%) Senior
6 25 (6.19%) Data Engineer
7 22 (5.45%) Solutions Architect
8 21 (5.20%) Consultant
9 15 (3.71%) Technical Architect
10 12 (2.97%) Data Scientist
10 12 (2.97%) Python Engineer
11 10 (2.48%) Technical Solutions Architect
12 9 (2.23%) Delivery Manager
12 9 (2.23%) Programme Manager
13 8 (1.98%) Artificial Intelligence Engineer
13 8 (1.98%) Integration Architect
13 8 (1.98%) JavaScript Engineer
Libraries, Frameworks & Software Standards
1 11 (2.72%) REST
2 10 (2.48%) PySpark
3 8 (1.98%) Kafka
4 6 (1.49%) React
5 5 (1.24%) AngularJS
5 5 (1.24%) Next.js
5 5 (1.24%) Node.js
5 5 (1.24%) PyTorch
5 5 (1.24%) TensorFlow
5 5 (1.24%) Vue
6 4 (0.99%) Akka
6 4 (0.99%) OAuth
6 4 (0.99%) Play Framework
6 4 (0.99%) SAML
6 4 (0.99%) SOAP
7 3 (0.74%) .NET
7 3 (0.74%) OpenID
7 3 (0.74%) Spring
7 3 (0.74%) Web Services
7 3 (0.74%) XACML
Miscellaneous
1 44 (10.89%) Management Information System
2 17 (4.21%) Algorithms
2 17 (4.21%) Product Ownership
3 10 (2.48%) Analytical Mindset
4 9 (2.23%) Distributed Systems
4 9 (2.23%) IoT
5 8 (1.98%) Renewable Energy
6 7 (1.73%) Data Structures
6 7 (1.73%) Legacy Systems
7 6 (1.49%) Data Centre
8 5 (1.24%) Device Driver
8 5 (1.24%) Embedded Systems
8 5 (1.24%) PMI
8 5 (1.24%) Team-Oriented Environment
9 4 (0.99%) Life Science
9 4 (0.99%) Onboarding
9 4 (0.99%) Operational Technology
10 3 (0.74%) Data Protection Act
10 3 (0.74%) Derivative
10 3 (0.74%) NHS
Operating Systems
1 12 (2.97%) Linux
2 8 (1.98%) Windows
3 3 (0.74%) Red Hat Enterprise Linux
4 2 (0.50%) Unix
4 2 (0.50%) Windows Server
5 1 (0.25%) Android
5 1 (0.25%) Apple iOS
5 1 (0.25%) Data ONTAP
Processes & Methodologies
1 152 (37.62%) Problem-Solving
2 115 (28.47%) Agile
3 81 (20.05%) Data Analysis
4 79 (19.55%) Stakeholder Management
5 78 (19.31%) Analytics
6 74 (18.32%) Project Management
7 59 (14.60%) Visualisation
8 58 (14.36%) Roadmaps
9 57 (14.11%) Business Intelligence
10 54 (13.37%) Data-Driven Decision Making
11 44 (10.89%) Data Modelling
12 43 (10.64%) Data Governance
13 42 (10.40%) Continuous Improvement
14 40 (9.90%) Data Visualisation
15 39 (9.65%) Artificial Intelligence
15 39 (9.65%) Data Science
16 38 (9.41%) Actionable Insight
17 37 (9.16%) Risk Management
18 36 (8.91%) Migration
18 36 (8.91%) User Experience
Programming Languages
1 86 (21.29%) SQL
2 76 (18.81%) Python
3 24 (5.94%) Java
4 16 (3.96%) R
5 14 (3.47%) JavaScript
6 10 (2.48%) TypeScript
7 8 (1.98%) T-SQL
8 6 (1.49%) Data Analysis Expressions
9 5 (1.24%) C
9 5 (1.24%) Embedded C
9 5 (1.24%) Scala
10 3 (0.74%) PowerShell
10 3 (0.74%) VBA
11 2 (0.50%) Bash
11 2 (0.50%) C#
12 1 (0.25%) Apex Code
12 1 (0.25%) Perl
12 1 (0.25%) PHP
12 1 (0.25%) PL/SQL
12 1 (0.25%) VB
Qualifications
1 66 (16.34%) Degree
2 45 (11.14%) Security Cleared
3 37 (9.16%) SC Cleared
4 16 (3.96%) Computer Science Degree
5 15 (3.71%) PMI Certification
6 13 (3.22%) PMP
7 11 (2.72%) BPSS Clearance
8 10 (2.48%) Master's Degree
9 7 (1.73%) Microsoft Certification
10 4 (0.99%) AWS Certification
10 4 (0.99%) CISSP
11 3 (0.74%) DV Cleared
12 2 (0.50%) CCNP
12 2 (0.50%) Cisco Certification
12 2 (0.50%) CISM
12 2 (0.50%) MBA
12 2 (0.50%) MRICS
12 2 (0.50%) Numerate Degree
12 2 (0.50%) PhD
12 2 (0.50%) SAP Certification
Quality Assurance & Compliance
1 35 (8.66%) Data Quality
2 21 (5.20%) Accessibility
3 19 (4.70%) QA
4 16 (3.96%) GDPR
5 11 (2.72%) PMO
6 7 (1.73%) Actionable Recommendations
7 5 (1.24%) NIST
8 4 (0.99%) ISO/IEC 27001
9 3 (0.74%) MiFID
9 3 (0.74%) NCSC
10 2 (0.50%) COBIT
10 2 (0.50%) Dodd-Frank
10 2 (0.50%) EMIR
10 2 (0.50%) Sarbanes-Oxley
11 1 (0.25%) Disclosure Scotland
11 1 (0.25%) GAAP
11 1 (0.25%) ISO 20022
11 1 (0.25%) ITGC
11 1 (0.25%) SEPA
11 1 (0.25%) WCAG
System Software
1 9 (2.23%) Docker
2 5 (1.24%) Firmware
3 4 (0.99%) Active Directory
4 3 (0.74%) RACF
4 3 (0.74%) VMware Infrastructure
5 1 (0.25%) KVM
5 1 (0.25%) Virtual Machines
5 1 (0.25%) VMware ESXi
5 1 (0.25%) VMware NSX
Systems Management
1 9 (2.23%) Terraform
2 6 (1.49%) Ansible
3 5 (1.24%) Kubernetes
4 4 (0.99%) Kibana
5 3 (0.74%) MOM
5 3 (0.74%) Packer
5 3 (0.74%) Single Sign-On
6 1 (0.25%) CSIRT
6 1 (0.25%) Docker Swarm
6 1 (0.25%) FortiGate
6 1 (0.25%) Grafana
6 1 (0.25%) Hadoop YARN
6 1 (0.25%) HAProxy
6 1 (0.25%) HP Quality Center
6 1 (0.25%) Microsoft Intune
6 1 (0.25%) Nagios
6 1 (0.25%) Podman
6 1 (0.25%) Prometheus
6 1 (0.25%) Red Hat Satellite
6 1 (0.25%) TrustSec
Vendors
1 54 (13.37%) Microsoft
2 18 (4.46%) SAP
3 17 (4.21%) Google
4 14 (3.47%) Oracle
5 8 (1.98%) Cisco
5 8 (1.98%) ServiceNow
6 5 (1.24%) Salesforce
7 4 (0.99%) Databricks
7 4 (0.99%) Palo Alto
7 4 (0.99%) Proofpoint
7 4 (0.99%) Siemens
7 4 (0.99%) VMware
8 3 (0.74%) Atlassian
8 3 (0.74%) ESRI
8 3 (0.74%) IBM
8 3 (0.74%) Red Hat
8 3 (0.74%) Rockwell
9 2 (0.50%) Adobe
9 2 (0.50%) Juniper
9 2 (0.50%) Workday