Google Jobs in Bristol

Google
South West > Bristol

The table below provides summary statistics for permanent job vacancies advertised in Bristol with a requirement for knowledge and experience of Google products and/or services. Included is a benchmarking guide to the salaries offered in vacancies that have cited Google over the 6 months to 5 May 2024 with a comparison to the same period in the previous 2 years.

The figures below represent the IT labour market in general and are not representative of salaries within Google.

6 months to
5 May 2024
Same period 2023 Same period 2022
Rank 62 81 121
Rank change year-on-year +19 +40 -34
Permanent jobs citing Google 109 104 72
As % of all permanent jobs advertised in Bristol 3.52% 3.92% 2.18%
As % of the Vendors category 12.96% 10.98% 6.99%
Number of salaries quoted 63 74 56
10th Percentile £28,500 £34,723 £42,500
25th Percentile £37,750 £44,125 £47,500
Median annual salary (50th Percentile) £60,000 £59,526 £60,000
Median % change year-on-year +0.80% -0.79% +14.29%
75th Percentile £80,000 £77,715 £73,225
90th Percentile £96,539 £111,252 £87,500
South West median annual salary £47,500 £52,500 £55,000
% change year-on-year -9.52% -4.55% +22.22%

All Vendors
Bristol

Google is in the Vendor Products and Services category. The following table is for comparison with the above and provides summary statistics for all permanent job vacancies with a requirement for knowledge or experience of vendor products and services advertised in Bristol.

Permanent vacancies with a requirement for knowledge or experience of vendor products and services 841 947 1,030
As % of all permanent jobs advertised in Bristol 27.15% 35.70% 31.21%
Number of salaries quoted 630 538 732
10th Percentile £28,500 £27,850 £28,500
25th Percentile £36,250 £36,518 £35,992
Median annual salary (50th Percentile) £52,500 £52,500 £47,500
Median % change year-on-year - +10.53% +5.56%
75th Percentile £70,000 £70,000 £63,500
90th Percentile £83,034 £80,000 £87,500
South West median annual salary £48,500 £46,000 £45,150
% change year-on-year +5.43% +1.88% +0.33%

Google
Job Vacancy Trend in Bristol

Job postings citing Google as a proportion of all IT jobs advertised in Bristol.
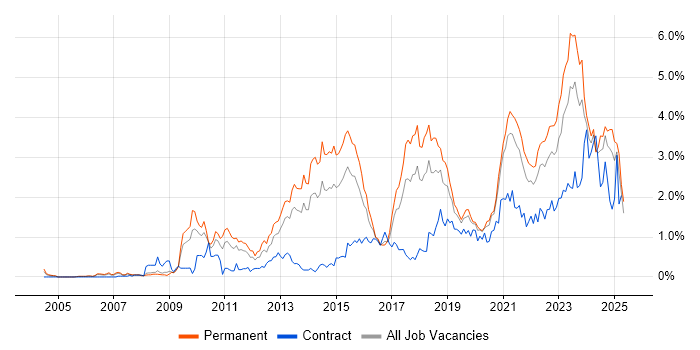
Job vacancy trend for Google in Bristol

Google
Salary Trend in Bristol

3-month moving average salary quoted in jobs citing Google in Bristol.

Salary trend for Google in Bristol

Google
Salary Histogram in Bristol

Salary distribution for jobs citing Google in Bristol over the 6 months to 5 May 2024.

Salary histogram for Google in Bristol

Google
Co-occurring Skills and Capabilities in Bristol by Category

The follow tables expand on the table above by listing co-occurrences grouped by category. The same employment type, locality and period is covered with up to 20 co-occurrences shown in each of the following categories:

Application Platforms
1 5 (4.59%) Apache Spark
1 5 (4.59%) Oracle Application Server
2 4 (3.67%) Apache
2 4 (3.67%) WordPress
3 2 (1.83%) Apache Airflow
3 2 (1.83%) CMS
3 2 (1.83%) Luigi
4 1 (0.92%) Confluence
4 1 (0.92%) SharePoint
Applications
1 6 (5.50%) MS Visio
2 1 (0.92%) Microsoft Project
Business Applications
1 2 (1.83%) SAP FI-GL
1 2 (1.83%) Shopify
2 1 (0.92%) Unit4 Business World
Cloud Services
1 61 (55.96%) GCP
2 51 (46.79%) Azure
3 44 (40.37%) AWS
4 14 (12.84%) SaaS
5 12 (11.01%) Google Analytics
6 11 (10.09%) Azure DevOps
7 10 (9.17%) Microsoft 365
8 8 (7.34%) Dropbox
8 8 (7.34%) Google Drive
8 8 (7.34%) OneDrive
8 8 (7.34%) Power Platform
8 8 (7.34%) Snowflake
9 6 (5.50%) Google Play
10 5 (4.59%) GitHub
10 5 (4.59%) PaaS
11 3 (2.75%) Google Tag Manager
12 2 (1.83%) Cloud Computing
12 2 (1.83%) GitHub Actions
12 2 (1.83%) Google Ads
12 2 (1.83%) Google Workspace
Communications & Networking
1 2 (1.83%) PBX
1 2 (1.83%) VoIP
2 1 (0.92%) DNS
2 1 (0.92%) Firewall
2 1 (0.92%) Internet
2 1 (0.92%) NAS
2 1 (0.92%) Wi-Fi
Database & Business Intelligence
1 29 (26.61%) Data Warehouse
2 26 (23.85%) BigQuery
3 22 (20.18%) Looker
4 10 (9.17%) SQL Server
5 9 (8.26%) Star Schema
6 8 (7.34%) Power BI
6 8 (7.34%) Tableau
7 7 (6.42%) Data Lake
7 7 (6.42%) NoSQL
8 5 (4.59%) Oracle BI EE
8 5 (4.59%) Relational Database
9 4 (3.67%) Bigtable
9 4 (3.67%) Oracle Database
9 4 (3.67%) PostgreSQL
10 3 (2.75%) Data Hub
10 3 (2.75%) Hadoop
10 3 (2.75%) OLAP
10 3 (2.75%) OLAP Cube
10 3 (2.75%) RDBMS
10 3 (2.75%) SQL Server Integration Services
Development Applications
1 13 (11.93%) Jenkins
2 12 (11.01%) Git
3 5 (4.59%) IBM UrbanCode
4 4 (3.67%) Oracle Forms
5 2 (1.83%) Rational DOORS
6 1 (0.92%) JIRA
6 1 (0.92%) VersionOne
General
1 36 (33.03%) Analytical Skills
2 32 (29.36%) Finance
3 29 (26.61%) Banking
4 13 (11.93%) Social Skills
5 10 (9.17%) Retail
6 9 (8.26%) Marketing
6 9 (8.26%) Presentation Skills
7 8 (7.34%) Billing
8 4 (3.67%) Retail Banking
9 3 (2.75%) Influencing Skills
10 2 (1.83%) Digital Economy
10 2 (1.83%) General Ledger
10 2 (1.83%) Organisational Skills
10 2 (1.83%) Public Sector
10 2 (1.83%) Telecoms
11 1 (0.92%) Aerospace
11 1 (0.92%) Brand Awareness
11 1 (0.92%) Documentation Skills
11 1 (0.92%) Inclusion and Diversity
Job Titles
1 22 (20.18%) Senior
2 20 (18.35%) Developer
3 17 (15.60%) Architect
4 13 (11.93%) Analyst
4 13 (11.93%) Data Engineer
5 11 (10.09%) Data Manager
6 10 (9.17%) Engineering Manager
7 9 (8.26%) Lead
8 8 (7.34%) Data Architect
9 7 (6.42%) Cloud Architect
9 7 (6.42%) Platform Engineer
9 7 (6.42%) Principal Engineer
9 7 (6.42%) Software Developer
10 6 (5.50%) .NET Developer
10 6 (5.50%) C# .NET Developer
10 6 (5.50%) C# Developer
10 6 (5.50%) Cloud Engineer
10 6 (5.50%) IT Technician
10 6 (5.50%) Senior IT Technician
10 6 (5.50%) Senior Technician
Libraries, Frameworks & Software Standards
1 12 (11.01%) HTML
2 10 (9.17%) .NET
2 10 (9.17%) .NET Framework
2 10 (9.17%) ASP.NET
2 10 (9.17%) Entity Framework
3 8 (7.34%) React
4 7 (6.42%) CSS
5 6 (5.50%) .NET Core
5 6 (5.50%) AngularJS
5 6 (5.50%) ASP.NET MVC
5 6 (5.50%) ASP.NET Web API
5 6 (5.50%) Twitter Bootstrap
6 5 (4.59%) Node.js
7 4 (3.67%) ADO.NET
7 4 (3.67%) jQuery
7 4 (3.67%) Oracle Fusion
7 4 (3.67%) RESTful
8 3 (2.75%) Kafka
8 3 (2.75%) Pandas
8 3 (2.75%) Spring
Miscellaneous
1 15 (13.76%) Product Ownership
1 15 (13.76%) Self-Motivation
2 14 (12.84%) Public Cloud
3 8 (7.34%) iPad
4 7 (6.42%) Mobile App
4 7 (6.42%) PKI
5 6 (5.50%) iPhone
6 3 (2.75%) Distributed Systems
7 2 (1.83%) Blackberry
7 2 (1.83%) Data Structures
7 2 (1.83%) Educational Technology
7 2 (1.83%) PropTech
7 2 (1.83%) Video Conferencing
8 1 (0.92%) Algorithms
8 1 (0.92%) Driving Licence
8 1 (0.92%) Mainframe
8 1 (0.92%) Online Banking
8 1 (0.92%) Reference Data
8 1 (0.92%) Social Media
Operating Systems
1 8 (7.34%) Android
1 8 (7.34%) Windows
2 2 (1.83%) Linux
3 1 (0.92%) CoreOS
3 1 (0.92%) Mac OS
3 1 (0.92%) Unix
3 1 (0.92%) Windows Server
3 1 (0.92%) zOS
Processes & Methodologies
1 57 (52.29%) Agile
2 34 (31.19%) Problem-Solving
3 33 (30.28%) DevOps
4 31 (28.44%) Data Engineering
5 29 (26.61%) Mentoring
6 24 (22.02%) ETL
6 24 (22.02%) Platform Engineering
7 21 (19.27%) Data Modelling
8 20 (18.35%) CI/CD
9 18 (16.51%) Analytics
9 18 (16.51%) Project Management
10 17 (15.60%) Scrum
11 15 (13.76%) Data Integration
12 14 (12.84%) Data Pipeline
13 13 (11.93%) Migration
14 12 (11.01%) Collaborative Working
14 12 (11.01%) Line Management
15 11 (10.09%) Roadmaps
16 10 (9.17%) Business Intelligence
16 10 (9.17%) Machine Learning
Programming Languages
1 27 (24.77%) SQL
2 19 (17.43%) JavaScript
2 19 (17.43%) Python
3 14 (12.84%) C#
4 12 (11.01%) Java
5 8 (7.34%) TypeScript
6 5 (4.59%) PHP
6 5 (4.59%) VBA
7 3 (2.75%) Scala
8 2 (1.83%) Bicep
8 2 (1.83%) Kotlin
9 1 (0.92%) PL/SQL
Qualifications
1 6 (5.50%) Degree
2 5 (4.59%) Security Cleared
3 3 (2.75%) SC Cleared
4 2 (1.83%) CCNP
4 2 (1.83%) Cisco Certification
4 2 (1.83%) DBS Check
4 2 (1.83%) DV Cleared
4 2 (1.83%) HND
4 2 (1.83%) Numerate Degree
4 2 (1.83%) TOGAF Certification
4 2 (1.83%) VMware Certified Professional (VCP)
Quality Assurance & Compliance
1 16 (14.68%) Data Quality
2 11 (10.09%) GDPR
3 10 (9.17%) QA
4 1 (0.92%) Actionable Recommendations
System Software
1 13 (11.93%) Docker
2 2 (1.83%) Apache Flume
2 2 (1.83%) VMware Infrastructure
3 1 (0.92%) Active Directory
Systems Management
1 12 (11.01%) Kubernetes
2 9 (8.26%) Terraform
3 1 (0.92%) Ansible
3 1 (0.92%) CA Endevor
3 1 (0.92%) Jamf Pro
3 1 (0.92%) Microsoft Intune
Vendors
1 19 (17.43%) Microsoft
2 10 (9.17%) Oracle
3 6 (5.50%) Databricks
4 2 (1.83%) Avaya
4 2 (1.83%) Cisco
4 2 (1.83%) Ericsson
4 2 (1.83%) IBM
4 2 (1.83%) Juniper
4 2 (1.83%) Nokia
4 2 (1.83%) Ribbon
4 2 (1.83%) SAP
4 2 (1.83%) VMware
5 1 (0.92%) Apple
5 1 (0.92%) Aruba
5 1 (0.92%) Civica
5 1 (0.92%) Facebook
5 1 (0.92%) Northgate
5 1 (0.92%) Salesforce
5 1 (0.92%) Splunk
5 1 (0.92%) Twitter