Windows Jobs in Edinburgh

Microsoft Windows
Scotland > Edinburgh

The following table provides summary statistics for permanent job vacancies advertised in Edinburgh with a requirement for Windows skills. Included is a benchmarking guide to the salaries offered in vacancies that have cited Windows over the 6 months to 2 May 2024 with a comparison to the same period in the previous 2 years.

6 months to
2 May 2024
Same period 2023 Same period 2022
Rank 20 44 36
Rank change year-on-year +24 -8 -14
Permanent jobs citing Windows 152 151 181
As % of all permanent jobs advertised in Edinburgh 10.00% 7.10% 7.70%
As % of the Operating Systems category 62.04% 45.07% 45.59%
Number of salaries quoted 98 99 119
10th Percentile £26,250 £26,250 £24,200
25th Percentile £27,500 £30,250 £30,000
Median annual salary (50th Percentile) £40,000 £47,500 £45,000
Median % change year-on-year -15.79% +5.56% +33.33%
75th Percentile £55,000 £67,688 £61,250
90th Percentile £80,000 £80,000 £67,000
Scotland median annual salary £40,000 £45,000 £37,500
% change year-on-year -11.11% +20.00% -6.25%

All Operating Systems
Edinburgh

Windows is in the Operating Systems category. The following table is for comparison with the above and provides summary statistics for all permanent job vacancies advertised in Edinburgh with a requirement for operating system skills.

Permanent vacancies with a requirement for operating system skills 245 335 397
As % of all permanent jobs advertised in Edinburgh 16.12% 15.74% 16.89%
Number of salaries quoted 176 197 269
10th Percentile £26,250 £28,500 £28,600
25th Percentile £36,250 £37,500 £42,500
Median annual salary (50th Percentile) £50,000 £55,000 £55,000
Median % change year-on-year -9.09% - +15.79%
75th Percentile £70,608 £72,500 £67,500
90th Percentile £91,934 £80,000 £73,750
Scotland median annual salary £49,990 £50,000 £50,000
% change year-on-year -0.02% - +11.11%

Windows
Job Vacancy Trend in Edinburgh

Job postings citing Windows as a proportion of all IT jobs advertised in Edinburgh.
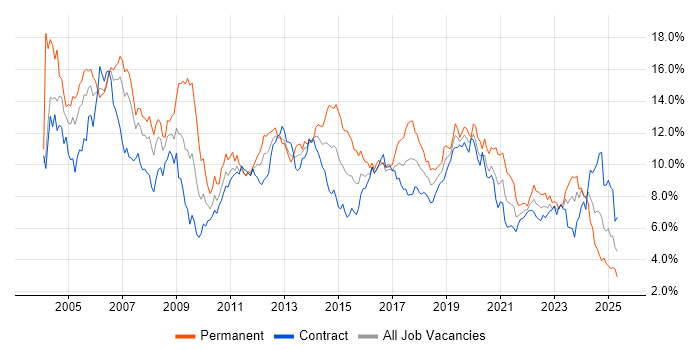
Job vacancy trend for Windows in Edinburgh

Windows
Salary Trend in Edinburgh

3-month moving average salary quoted in jobs citing Windows in Edinburgh.

Salary trend for Windows in Edinburgh

Windows
Salary Histogram in Edinburgh

Salary distribution for jobs citing Windows in Edinburgh over the 6 months to 2 May 2024.

Salary histogram for Windows in Edinburgh

Windows
Co-occurring Skills and Capabilities in Edinburgh by Category

The follow tables expand on the table above by listing co-occurrences grouped by category. The same employment type, locality and period is covered with up to 20 co-occurrences shown in each of the following categories:

Application Platforms
1 8 (5.26%) Microsoft Exchange
2 5 (3.29%) Apache
2 5 (3.29%) SharePoint
Applications
1 8 (5.26%) Microsoft Office
2 4 (2.63%) Microsoft Excel
2 4 (2.63%) Microsoft PowerPoint
Business Applications
1 12 (7.89%) Unit4 Business World
Cloud Services
1 52 (34.21%) Microsoft 365
2 44 (28.95%) Azure
3 23 (15.13%) SaaS
4 20 (13.16%) Entra ID
5 11 (7.24%) AWS
6 8 (5.26%) Azure DevOps
7 6 (3.95%) GCP
8 5 (3.29%) Amazon S3
9 4 (2.63%) Cloud Computing
9 4 (2.63%) Google Docs
9 4 (2.63%) Google Workspace
9 4 (2.63%) Mimecast
9 4 (2.63%) OneDrive
10 3 (1.97%) Azure Sentinel
10 3 (1.97%) OpenShift
10 3 (1.97%) WhatsApp
11 1 (0.66%) AWS CloudFormation
11 1 (0.66%) IaaS
11 1 (0.66%) PaaS
11 1 (0.66%) Slack
Communications & Networking
1 19 (12.50%) Firewall
2 12 (7.89%) TCP/IP
3 9 (5.92%) DNS
3 9 (5.92%) Wireless
4 8 (5.26%) DHCP
4 8 (5.26%) Internet
4 8 (5.26%) VPN
5 7 (4.61%) WAN
6 6 (3.95%) SNMP
7 5 (3.29%) IPsec
8 3 (1.97%) LAN
8 3 (1.97%) WLAN
9 2 (1.32%) NetScaler
10 1 (0.66%) Cisco Firepower
10 1 (0.66%) Network Security
10 1 (0.66%) SD-WAN
Database & Business Intelligence
1 12 (7.89%) DB2
1 12 (7.89%) SQL Server
2 5 (3.29%) Elasticsearch
2 5 (3.29%) MongoDB
3 4 (2.63%) Azure SQL Database
4 3 (1.97%) Big Data
5 1 (0.66%) Amazon RDS
5 1 (0.66%) InfluxDB
5 1 (0.66%) MySQL
5 1 (0.66%) RDBMS
5 1 (0.66%) Relational Database
Development Applications
1 5 (3.29%) JIRA
2 4 (2.63%) IBM UrbanCode
3 2 (1.32%) GitLab
4 1 (0.66%) Git
4 1 (0.66%) Jenkins
4 1 (0.66%) MSI
4 1 (0.66%) SonarQube
4 1 (0.66%) Subversion
General
1 40 (26.32%) Social Skills
2 34 (22.37%) Finance
3 14 (9.21%) Military
4 12 (7.89%) Public Sector
5 11 (7.24%) Inclusion and Diversity
6 10 (6.58%) Banking
7 9 (5.92%) Telecoms
8 5 (3.29%) Organisational Skills
9 4 (2.63%) Billing
9 4 (2.63%) Legal
10 3 (1.97%) Presentation Skills
10 3 (1.97%) Retail
11 2 (1.32%) Analytical Skills
11 2 (1.32%) Law
12 1 (0.66%) Documentation Skills
12 1 (0.66%) Games
12 1 (0.66%) Manufacturing
12 1 (0.66%) Marketing
12 1 (0.66%) Publishing
12 1 (0.66%) Retail Banking
Job Titles
1 31 (20.39%) Senior
2 27 (17.76%) Analyst
3 21 (13.82%) IT Engineer
3 21 (13.82%) Support Analyst
4 17 (11.18%) IT Support
4 17 (11.18%) Support Engineer
5 16 (10.53%) IT Manager
6 14 (9.21%) Threat Intelligence Analyst
7 12 (7.89%) Windows Engineer
8 10 (6.58%) IT Analyst
9 9 (5.92%) 2nd Line Support
9 9 (5.92%) Consultant
9 9 (5.92%) IT Support Engineer
9 9 (5.92%) Principal Engineer
9 9 (5.92%) Principal Software Engineer
9 9 (5.92%) Senior Software Engineer
9 9 (5.92%) Senior Windows Engineer
9 9 (5.92%) Software Engineer
10 8 (5.26%) Audit Manager
10 8 (5.26%) IT Audit Manager
Libraries, Frameworks & Software Standards
1 5 (3.29%) LDAP
1 5 (3.29%) RabbitMQ
1 5 (3.29%) YAML
2 1 (0.66%) Elastic Stack
Miscellaneous
1 10 (6.58%) Cloud Native
2 9 (5.92%) Virtual Team
3 7 (4.61%) Data Centre
3 7 (4.61%) Public Cloud
4 6 (3.95%) Driving Licence
4 6 (3.95%) Onboarding
5 4 (2.63%) Private Cloud
6 3 (1.97%) Device Driver
7 2 (1.32%) EPoS
8 1 (0.66%) Distributed Systems
8 1 (0.66%) Embedded Systems
8 1 (0.66%) Hybrid Cloud
8 1 (0.66%) Mainframe
8 1 (0.66%) Management Information System
8 1 (0.66%) Renewable Energy
8 1 (0.66%) Self-Motivation
Operating Systems
1 73 (48.03%) Linux
2 53 (34.87%) Windows Server
3 40 (26.32%) Unix
4 16 (10.53%) Mac OS X
5 14 (9.21%) Mac OS
6 12 (7.89%) Windows 10
7 5 (3.29%) Apple iOS
7 5 (3.29%) Data ONTAP
8 4 (2.63%) Windows Server 2012
8 4 (2.63%) Windows Server 2016
9 3 (1.97%) Android
9 3 (1.97%) CentOS
10 1 (0.66%) CoreOS
10 1 (0.66%) Embedded Linux
10 1 (0.66%) OpenWrt
10 1 (0.66%) VMS
10 1 (0.66%) zOS
Processes & Methodologies
1 38 (25.00%) Cybersecurity
2 36 (23.68%) Customer Service
3 31 (20.39%) Agile
4 26 (17.11%) DevOps
4 26 (17.11%) Problem-Solving
5 25 (16.45%) ITIL
6 24 (15.79%) Cyber Threat Intelligence
6 24 (15.79%) Threat Intelligence
7 22 (14.47%) Actionable Insight
7 22 (14.47%) Analytics
7 22 (14.47%) Service Delivery
8 20 (13.16%) Information Security
9 18 (11.84%) Project Management
10 16 (10.53%) Creative Thinking
10 16 (10.53%) Incident Management
10 16 (10.53%) Incident Response
11 15 (9.87%) Security Operations
12 14 (9.21%) Open Source
12 14 (9.21%) Resource Management
12 14 (9.21%) Situational Awareness
Programming Languages
1 23 (15.13%) SQL
2 13 (8.55%) PowerShell
3 10 (6.58%) Bash
4 7 (4.61%) Python
5 3 (1.97%) Groovy
6 1 (0.66%) Assembly Language
6 1 (0.66%) C
6 1 (0.66%) C++
6 1 (0.66%) Perl
6 1 (0.66%) T-SQL
Qualifications
1 40 (26.32%) Degree
2 14 (9.21%) CISM
2 14 (9.21%) CISSP
2 14 (9.21%) GCIA
2 14 (9.21%) GCIH
2 14 (9.21%) GREM
3 12 (7.89%) CISA
4 4 (2.63%) Microsoft Certification
5 2 (1.32%) Azure Certification
5 2 (1.32%) MCSE
5 2 (1.32%) SC Cleared
5 2 (1.32%) Security Cleared
5 2 (1.32%) VMware Certified Professional (VCP)
Quality Assurance & Compliance
1 12 (7.89%) ITGC
1 12 (7.89%) PMO
2 5 (3.29%) ISO/IEC 27001
3 4 (2.63%) SLA
3 4 (2.63%) SOC 2
4 1 (0.66%) Cyber Essentials
4 1 (0.66%) GDPR
4 1 (0.66%) NIST
4 1 (0.66%) SOC 3
System Software
1 37 (24.34%) Active Directory
2 13 (8.55%) VMware Infrastructure
3 11 (7.24%) Docker
4 10 (6.58%) Hyper-V
5 3 (1.97%) Virtual Machines
6 2 (1.32%) VMware ESXi
6 2 (1.32%) vSphere
6 2 (1.32%) XenDesktop
7 1 (0.66%) Firmware
7 1 (0.66%) Microsoft App-V
Systems Management
1 20 (13.16%) Ansible
2 18 (11.84%) Microsoft Intune
3 14 (9.21%) Kubernetes
4 11 (7.24%) Terraform
5 10 (6.58%) Prometheus
6 8 (5.26%) SCCM
7 7 (4.61%) vCenter Server
8 5 (3.29%) Grafana
9 3 (1.97%) Progress Chef
10 1 (0.66%) CA Endevor
10 1 (0.66%) CASB
10 1 (0.66%) CSIRT
10 1 (0.66%) Jamf Pro
10 1 (0.66%) WMI
10 1 (0.66%) WSUS
Vendors
1 44 (28.95%) Microsoft
2 33 (21.71%) Dell
3 26 (17.11%) VMware
4 15 (9.87%) Google
5 13 (8.55%) Oracle
6 12 (7.89%) Sage
6 12 (7.89%) SAP
7 6 (3.95%) iManage
7 6 (3.95%) NetApp
8 5 (3.29%) Citrix
8 5 (3.29%) ConnectWise
8 5 (3.29%) HP
8 5 (3.29%) Palo Alto
8 5 (3.29%) Red Hat
8 5 (3.29%) ServiceNow
8 5 (3.29%) SolidFire
9 4 (2.63%) Aderant
9 4 (2.63%) Apple
9 4 (2.63%) BeyondTrust
9 4 (2.63%) CyberArk