Microsoft Hyper-V
Hampshire > Fleet
The table below provides summary statistics and salary benchmarking for jobs advertised in Fleet requiring Hyper-V skills. It covers permanent job vacancies from the 6 months leading up to 2 November 2025, with comparisons to the same periods in the previous two years.
| 6 months to 2 Nov 2025 |
Same period 2024 | Same period 2023 | |
|---|---|---|---|
| Rank | 23 | - | - |
| Rank change year-on-year | - | - | - |
| Permanent jobs citing Hyper-V | 2 | 0 | 0 |
| As % of all permanent jobs in Fleet | 2.38% | - | - |
| As % of the System Software category | 28.57% | - | - |
| Number of salaries quoted | 2 | 0 | 0 |
| 10th Percentile | £45,750 | - | - |
| 25th Percentile | £46,500 | - | - |
| Median annual salary (50th Percentile) | £48,000 | - | - |
| 75th Percentile | £49,500 | - | - |
| 90th Percentile | £50,250 | - | - |
| Hampshire median annual salary | £31,000 | £46,000 | £50,000 |
| % change year-on-year | -32.61% | -8.00% | +42.86% |
All System Software Skills
Fleet
Hyper-V falls under the System Software category. For comparison with the information above, the following table provides summary statistics for all permanent job vacancies requiring system software skills in Fleet.
| Permanent vacancies with a requirement for system software skills | 7 | 0 | 0 |
| As % of all permanent jobs advertised in Fleet | 8.33% | - | - |
| Number of salaries quoted | 2 | 0 | 0 |
| 10th Percentile | £45,750 | - | - |
| 25th Percentile | £46,500 | - | - |
| Median annual salary (50th Percentile) | £48,000 | - | - |
| 75th Percentile | £49,500 | - | - |
| 90th Percentile | £50,250 | - | - |
| Hampshire median annual salary | £54,375 | £55,000 | £46,000 |
| % change year-on-year | -1.14% | +19.57% | -8.00% |
Hyper-V
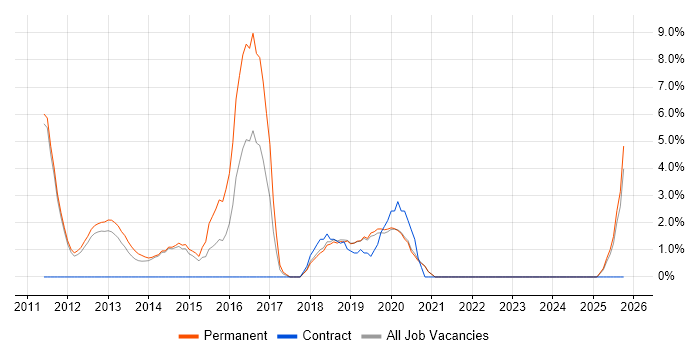
Job Vacancy Trend in Fleet
Historical trend showing the proportion of permanent IT job postings citing Hyper-V relative to all permanent IT jobs advertised in Fleet.

Hyper-V
Salary Trend in Fleet
Salary distribution trend for jobs in Fleet citing Hyper-V.

Hyper-V
Co-Occurring Skills & Capabilities in Fleet by Category
The following tables expand on the one above by listing co-occurrences grouped by category. They cover the same employment type, locality and period, with up to 20 co-occurrences shown in each category:
