
Senior Job Trends in West Yorkshire

Senior
Yorkshire > West Yorkshire

The median Senior salary in West Yorkshire is £70,000 per year, according to job vacancies posted during the 6 months leading to 10 October 2026.

The table below compares current salary benchmarking and summary statistics with the previous two years.

6 months to
10 Oct 2026
Same period 2025 Same period 2024
Rank 2 16 2
Rank change year-on-year +14 -14 +3
Permanent jobs requiring a Senior 555 163 348
As % of all permanent jobs in West Yorkshire 13.43% 10.44% 16.93%
As % of the Job Titles category 14.18% 11.26% 17.64%
Number of salaries quoted 403 113 181
10th Percentile £46,400 £45,000 £45,000
25th Percentile £60,000 £50,000 £48,250
Median annual salary (50th Percentile) £70,000 £62,500 £55,000
Median % change year-on-year +12.00% +13.64% -8.33%
75th Percentile £80,000 £73,750 £70,000
90th Percentile £85,000 £80,000 £75,772
Yorkshire median annual salary £69,305 £60,000 £57,500
% change year-on-year +15.51% +4.35% -4.17%

All Permanent IT Job Roles
West Yorkshire

For comparison with the information above, the following table provides summary statistics for all permanent IT job vacancies in West Yorkshire. Most job vacancies include a discernible job title that can be normalized. As such, the figures in the second row provide an indication of the number of permanent jobs in our overall sample.

Permanent vacancies in West Yorkshire with a recognized job title 3,914 1,448 1,973
% of permanent jobs with a recognized job title 94.72% 92.70% 96.01%
Number of salaries quoted 2,818 766 1,147
10th Percentile £30,500 £28,250 £29,900
25th Percentile £42,500 £36,750 £40,025
Median annual salary (50th Percentile) £60,000 £55,000 £52,500
Median % change year-on-year +9.09% +4.76% -4.55%
75th Percentile £71,057 £70,000 £69,500
90th Percentile £90,000 £82,500 £82,500
Yorkshire median annual salary £52,000 £45,000 £50,000
% change year-on-year +15.56% -10.00% -4.76%

Senior
Job Vacancy Trend in West Yorkshire

Historical trend showing the proportion of permanent IT job postings featuring 'Senior' in the job title relative to all permanent IT jobs advertised in West Yorkshire.
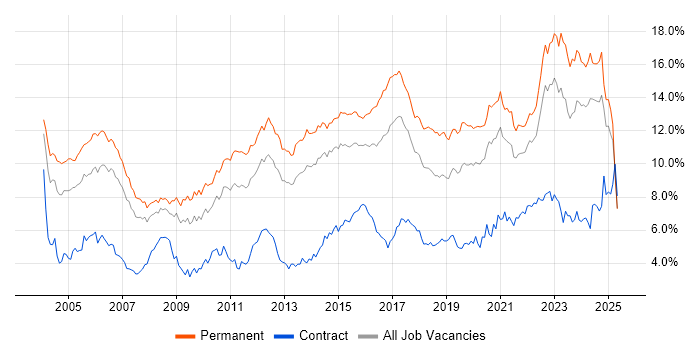
Senior job vacancy trend in West Yorkshire

Senior
Salary Trend in West Yorkshire

Salary distribution trend for Senior job vacancies in West Yorkshire.
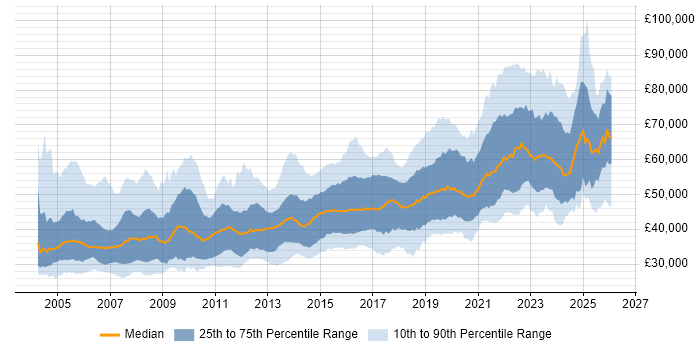
Salary distribution trend for Senior job vacancies in West Yorkshire

Senior
Salary Histogram in West Yorkshire

Salary distribution for jobs citing Senior in West Yorkshire over the 6 months to 10 October 2026.

Salary histogram for Senior in West Yorkshire

Senior
Job Locations in West Yorkshire

The table below looks at the demand and provides a guide to the median salaries quoted in IT jobs citing Senior within the West Yorkshire region over the 6 months to 10 October 2026. The 'Rank Change' column provides an indication of the change in demand within each location based on the same 6 month period last year.

Location Rank Change
on Same Period
Last Year
Matching
Permanent
IT Job Ads
Median Salary
Past 6 Months
Median Salary
% Change
on Same Period
Last Year
Live
Jobs
Leeds +3 462 £70,000 +12.00% 238
Bradford +26 49 £65,000 -16.13% 24
Wakefield - 19 £55,000 - 9
Huddersfield - 8 £35,000 - 7
Dewsbury - 5 - -
Brighouse - 4 £45,000 -
Halifax - 3 £34,000 - 3
Batley +1 1 £28,000 -41.05%
Pontefract - 1 £65,000 -
Senior
Yorkshire

Senior Skill Set
Top 30 Co-Occurring Skills & Capabilities in West Yorkshire

For the 6 months to 10 October 2026, Senior job roles required the following skills and capabilities in order of popularity. The figures indicate the absolute number of co-occurrences and as a proportion of all permanent job ads across the West Yorkshire region featuring Senior in the job title.

1 71 (12.79%) Agile
2 68 (12.25%) Software Engineering
3 63 (11.35%) AWS
4 52 (9.37%) Azure
5 51 (9.19%) CI/CD
6 48 (8.65%) DevOps
7 47 (8.47%) Full-Stack Development
8 45 (8.11%) Continuous Improvement
9 44 (7.93%) Java
9 44 (7.93%) Mentoring
10 40 (7.21%) Problem-Solving
11 38 (6.85%) Microsoft
12 33 (5.95%) SQL
13 31 (5.59%) Coaching
14 30 (5.41%) Infrastructure Engineering
15 29 (5.23%) TypeScript
16 28 (5.05%) Analytics
17 27 (4.86%) Business Development
17 27 (4.86%) Line Management
18 25 (4.50%) Security Cleared
19 24 (4.32%) Decision-Making
19 24 (4.32%) JavaScript
19 24 (4.32%) Python
20 23 (4.14%) Node.js
21 21 (3.78%) Data Engineering
21 21 (3.78%) SC Cleared
22 20 (3.60%) Degree
22 20 (3.60%) Microservices
23 19 (3.42%) AngularJS
23 19 (3.42%) GitHub

Senior Skill Set
Co-Occurring Skills & Capabilities in West Yorkshire by Category

The following tables expand on the one above by listing co-occurrences grouped by category. They cover the same employment type, locality and period, with up to 20 co-occurrences shown in each category:

Application Platforms
1 4 (0.72%) Oracle Workflow
2 3 (0.54%) CMS
2 3 (0.54%) IIS
2 3 (0.54%) SharePoint
2 3 (0.54%) SharePoint Server
3 2 (0.36%) Apache Airflow
3 2 (0.36%) Apache Spark
3 2 (0.36%) WordPress
4 1 (0.18%) Apache
4 1 (0.18%) Confluence
Applications
1 5 (0.90%) Microsoft Excel
1 5 (0.90%) Revit
2 3 (0.54%) Navisworks
3 2 (0.36%) AutoCAD
3 2 (0.36%) Civil 3D
3 2 (0.36%) Microsoft Office
3 2 (0.36%) Trello
Business Applications
1 3 (0.54%) SAP S/4HANA
2 2 (0.36%) Oracle Cash Management
2 2 (0.36%) Oracle EBS
2 2 (0.36%) Oracle Payables
2 2 (0.36%) Oracle Subledger Accounting
3 1 (0.18%) Oracle ERP
Cloud Services
1 63 (11.35%) AWS
2 52 (9.37%) Azure
3 19 (3.42%) GitHub
4 15 (2.70%) GitHub Actions
5 13 (2.34%) GCP
6 12 (2.16%) AWS CloudFormation
6 12 (2.16%) Serverless
7 11 (1.98%) Amazon S3
8 10 (1.80%) Azure DevOps
9 9 (1.62%) Amazon ECS
9 9 (1.62%) AWS Lambda
10 7 (1.26%) AWS Step Functions
11 6 (1.08%) Amazon EC2
11 6 (1.08%) Azure Synapse Analytics
11 6 (1.08%) Google Tag Manager
12 5 (0.90%) dbt
12 5 (0.90%) SaaS
12 5 (0.90%) Snowflake
13 4 (0.72%) Alation
13 4 (0.72%) Amazon OpenSearch
Communications & Networking
1 9 (1.62%) DNS
2 6 (1.08%) LAN
3 5 (0.90%) DHCP
3 5 (0.90%) TCP/IP
3 5 (0.90%) WAN
3 5 (0.90%) Wi-Fi
4 4 (0.72%) NAS
4 4 (0.72%) SAN
5 3 (0.54%) BGP
5 3 (0.54%) Firewall
5 3 (0.54%) Network Security
5 3 (0.54%) OSPF
5 3 (0.54%) TETRA
5 3 (0.54%) VPN
6 2 (0.36%) Ethernet VPN
6 2 (0.36%) HTTP
6 2 (0.36%) NGFW
6 2 (0.36%) VLAN
6 2 (0.36%) Wireless
6 2 (0.36%) WLAN
Database & Business Intelligence
1 9 (1.62%) DynamoDB
2 8 (1.44%) Data Warehouse
2 8 (1.44%) MySQL
2 8 (1.44%) SQL Server
3 7 (1.26%) Relational Database
3 7 (1.26%) SQL Server Integration Services
4 4 (0.72%) Data Lake
4 4 (0.72%) MariaDB
4 4 (0.72%) Metadata
5 3 (0.54%) Amazon RDS
5 3 (0.54%) Amazon Redshift
5 3 (0.54%) Big Data
5 3 (0.54%) BigQuery
5 3 (0.54%) Enterprise Data Warehouse
5 3 (0.54%) MongoDB
5 3 (0.54%) Tableau
6 2 (0.36%) Azure SQL Database
6 2 (0.36%) Oracle BI Publisher
6 2 (0.36%) Power BI
6 2 (0.36%) SQL Server Reporting Services
Development Applications
1 12 (2.16%) Jenkins
2 6 (1.08%) GitLab
3 5 (0.90%) Cypress.io
4 4 (0.72%) Git
5 3 (0.54%) JIRA
6 2 (0.36%) Claude Code
6 2 (0.36%) JMeter
6 2 (0.36%) Postman
7 1 (0.18%) Maven
General
1 56 (10.09%) Public Sector
2 45 (8.11%) Finance
2 45 (8.11%) Social Skills
3 30 (5.41%) Analytical Skills
4 21 (3.78%) Telecoms
5 15 (2.70%) Retail
6 13 (2.34%) Organisational Skills
7 11 (1.98%) Banking
7 11 (1.98%) Electronics
8 10 (1.80%) Inclusion and Diversity
8 10 (1.80%) Influencing Skills
9 7 (1.26%) Games
10 6 (1.08%) iGaming
11 5 (0.90%) Legal
12 4 (0.72%) Back Office
13 3 (0.54%) Agriculture
13 3 (0.54%) Automotive
13 3 (0.54%) Local Government
13 3 (0.54%) Manufacturing
13 3 (0.54%) Marketing
Libraries, Frameworks & Software Standards
1 23 (4.14%) Node.js
2 19 (3.42%) AngularJS
3 17 (3.06%) React
3 17 (3.06%) Terraform
4 14 (2.52%) .NET
4 14 (2.52%) Spring
5 12 (2.16%) Spring Boot
6 7 (1.26%) RESTful
7 6 (1.08%) CSS
7 6 (1.08%) HTML
7 6 (1.08%) REST
7 6 (1.08%) Web Services
8 4 (0.72%) Kafka
8 4 (0.72%) Laravel
8 4 (0.72%) Playwright
9 3 (0.54%) CSS3
9 3 (0.54%) Express.js
9 3 (0.54%) HTML5
9 3 (0.54%) NestJS
9 3 (0.54%) React Native
Miscellaneous
1 21 (3.78%) Cloud Native
2 16 (2.88%) Onboarding
3 12 (2.16%) Cyberattack
4 11 (1.98%) SCADA
5 9 (1.62%) Driving Licence
5 9 (1.62%) Greenfield Project
5 9 (1.62%) Legacy Systems
6 7 (1.26%) Sports Betting
7 5 (0.90%) Data Centre
7 5 (0.90%) NHS
8 4 (0.72%) Mobile App
9 3 (0.54%) Distributed Systems
9 3 (0.54%) Enterprise Software
9 3 (0.54%) Legacy Applications
9 3 (0.54%) Operational Technology
9 3 (0.54%) Product Ownership
9 3 (0.54%) Self-Motivation
10 2 (0.36%) AI Agents
10 2 (0.36%) Educational Technology
10 2 (0.36%) Legacy Code
Operating Systems
1 12 (2.16%) Linux
2 11 (1.98%) Windows
3 8 (1.44%) Unix
4 4 (0.72%) Windows Server
Processes & Methodologies
1 71 (12.79%) Agile
2 68 (12.25%) Software Engineering
3 51 (9.19%) CI/CD
4 48 (8.65%) DevOps
5 47 (8.47%) Full-Stack Development
6 45 (8.11%) Continuous Improvement
7 44 (7.93%) Mentoring
8 40 (7.21%) Problem-Solving
9 31 (5.59%) Coaching
10 30 (5.41%) Infrastructure Engineering
11 28 (5.05%) Analytics
12 27 (4.86%) Business Development
12 27 (4.86%) Line Management
13 24 (4.32%) Decision-Making
14 21 (3.78%) Data Engineering
15 20 (3.60%) Microservices
16 18 (3.24%) Infrastructure as Code
16 18 (3.24%) Scrum
16 18 (3.24%) Stakeholder Management
16 18 (3.24%) Test Automation
Programming Languages
1 44 (7.93%) Java
2 33 (5.95%) SQL
3 29 (5.23%) TypeScript
4 24 (4.32%) JavaScript
4 24 (4.32%) Python
5 19 (3.42%) Kotlin
5 19 (3.42%) PHP
6 17 (3.06%) C#
7 6 (1.08%) Delphi
7 6 (1.08%) T-SQL
8 5 (0.90%) Groovy
8 5 (0.90%) PowerShell
9 3 (0.54%) Bicep
9 3 (0.54%) Kusto Query Language
10 2 (0.36%) PL/SQL
10 2 (0.36%) Ruby
11 1 (0.18%) Bash
11 1 (0.18%) C++
11 1 (0.18%) Perl
11 1 (0.18%) Scala
Qualifications
1 25 (4.50%) Security Cleared
2 21 (3.78%) SC Cleared
3 20 (3.60%) Degree
4 11 (1.98%) City & Guilds
4 11 (1.98%) NVQ Level 3
5 10 (1.80%) Chartered Engineer
6 4 (0.72%) ACCA
6 4 (0.72%) CIMA
7 3 (0.54%) Cisco Certification
7 3 (0.54%) CISM
7 3 (0.54%) HNC
7 3 (0.54%) HND
7 3 (0.54%) PMI Certification
7 3 (0.54%) PMP
8 2 (0.36%) AWS Certification
8 2 (0.36%) CCNP
8 2 (0.36%) CISSP
8 2 (0.36%) DBS Check
9 1 (0.18%) (ISC)2 CCSP
9 1 (0.18%) BPSS Clearance
Quality Assurance & Compliance
1 11 (1.98%) Accessibility
2 10 (1.80%) QA
3 8 (1.44%) Data Quality
4 5 (0.90%) GRC
4 5 (0.90%) WCAG
5 4 (0.72%) Sarbanes-Oxley
6 3 (0.54%) ISO 19650
7 2 (0.36%) PMO
7 2 (0.36%) SLA
8 1 (0.18%) GDPR
8 1 (0.18%) ISO/IEC 27001
System Software
1 14 (2.52%) Docker
2 6 (1.08%) Active Directory
3 4 (0.72%) Hyper-V
3 4 (0.72%) VMware Infrastructure
Systems Management
1 9 (1.62%) Kubernetes
2 4 (0.72%) Progress Chef
3 3 (0.54%) VxRail
3 3 (0.54%) WSUS
4 2 (0.36%) Argo
5 1 (0.18%) Avamar
Vendors
1 38 (6.85%) Microsoft
2 13 (2.34%) Google
3 11 (1.98%) NEC
4 10 (1.80%) Oracle
4 10 (1.80%) SAP
5 6 (1.08%) Cisco
6 4 (0.72%) Dell
6 4 (0.72%) Foundry
6 4 (0.72%) Pega
6 4 (0.72%) Teradata
6 4 (0.72%) Veeam
6 4 (0.72%) VMware
6 4 (0.72%) Zerto
7 3 (0.54%) Autodesk
7 3 (0.54%) Commvault
7 3 (0.54%) HP
7 3 (0.54%) Meraki
7 3 (0.54%) ServiceNow
7 3 (0.54%) Tenable
8 2 (0.36%) Databricks