Senior Jobs in Yorkshire

Senior
England > Yorkshire

The median Senior salary in Yorkshire is £60,000 per year according to job vacancies posted during the 6 months to 1 December 2023.

The first table below provides salary benchmarking and summary statistics including a comparison to same period in the previous 2 years.

6 months to
1 Dec 2023
Same period 2022 Same period 2021
Rank 8 9 10
Rank change year-on-year +1 +1 -2
Permanent jobs requiring a Senior 495 1,078 930
As % of all permanent jobs advertised in Yorkshire 15.41% 15.47% 13.43%
As % of the Job Titles category 15.88% 15.97% 14.06%
Number of salaries quoted 332 568 708
10th Percentile £46,250 £43,000 £41,250
25th Percentile £51,813 £47,500 £46,250
Median annual salary (50th Percentile) £60,000 £62,500 £55,000
Median % change year-on-year -4.00% +13.64% +14.58%
75th Percentile £70,000 £77,500 £68,750
90th Percentile £83,750 £87,500 £79,125
England median annual salary £67,500 £70,000 £67,500
% change year-on-year -3.57% +3.70% +8.00%

All Permanent IT Job Vacancies
Yorkshire

The following table is for comparison with the above and includes summary statistics for all permanent IT job vacancies advertised in Yorkshire. Most job vacancies include a discernible job title that can be normalized. As such, the figures in the second row provide an indication of the number of permanent jobs in our overall sample.

Permanent vacancies in Yorkshire with a recognized job title 3,117 6,750 6,616
% of permanent jobs with a recognized job title 97.01% 96.87% 95.55%
Number of salaries quoted 2,220 3,846 5,058
10th Percentile £28,750 £29,875 £30,000
25th Percentile £37,500 £40,000 £37,500
Median annual salary (50th Percentile) £52,500 £52,500 £50,000
Median % change year-on-year - +5.00% +11.11%
75th Percentile £67,500 £70,813 £65,000
90th Percentile £83,750 £85,000 £77,500
England median annual salary £60,000 £60,000 £57,500
% change year-on-year - +4.35% +4.55%

Senior
Job Vacancy Trend in Yorkshire

Job postings that featured Senior in the job title as a proportion of all IT jobs advertised in Yorkshire.
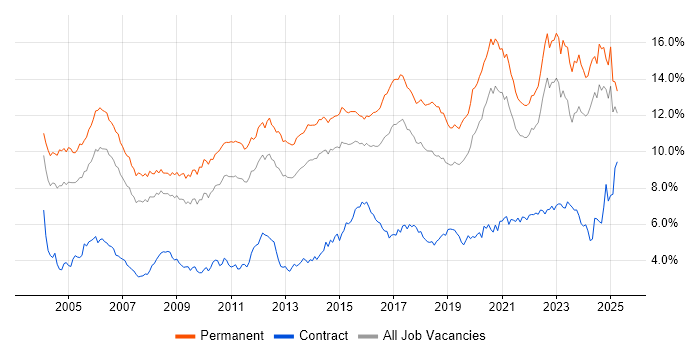
Job vacancy trend for Senior in Yorkshire

Senior
Salary Trend in Yorkshire

3-month moving average salary quoted in jobs citing Senior in Yorkshire.

Salary trend for Senior in Yorkshire

Senior
Salary Histogram in Yorkshire

Salary distribution for jobs citing Senior in Yorkshire over the 6 months to 1 December 2023.

Salary histogram for Senior in Yorkshire

Senior
Job Locations in Yorkshire

The table below looks at the demand and provides a guide to the median salaries quoted in IT jobs citing Senior within the Yorkshire region over the 6 months to 1 December 2023. The 'Rank Change' column provides an indication of the change in demand within each location based on the same 6 month period last year.

Location Rank Change
on Same Period
Last Year
Matching
Permanent
IT Job Ads
Median Salary
Past 6 Months
Median Salary
% Change
on Same Period
Last Year
Live
Jobs
West Yorkshire +5 390 £60,000 -4.00% 114
South Yorkshire -3 52 £60,000 +7.14% 45
North Yorkshire -3 36 £60,000 +14.29% 26
East Yorkshire +4 15 £52,500 +10.53% 13
Senior
England

Senior Skill Set
Top 30 Co-occurring Skills and Capabilities in Yorkshire

For the 6 months to 1 December 2023, Senior job roles required the following skills and capabilities in order of popularity. The figures indicate the absolute number co-occurrences and as a proportion of all permanent job ads across the Yorkshire region featuring Senior in the job title.

1 185 (37.37%) Agile
2 147 (29.70%) Finance
3 115 (23.23%) SQL
4 107 (21.62%) Degree
5 105 (21.21%) Azure
6 104 (21.01%) Social Skills
7 99 (20.00%) Problem-Solving
8 91 (18.38%) .NET
9 84 (16.97%) CI/CD
10 82 (16.57%) DevOps
11 75 (15.15%) AWS
12 70 (14.14%) C#
13 68 (13.74%) Software Engineering
14 67 (13.54%) Python
15 64 (12.93%) Microsoft
16 62 (12.53%) Analytical Skills
17 60 (12.12%) ERP
18 58 (11.72%) JavaScript
19 56 (11.31%) ITIL
19 56 (11.31%) Mentoring
20 54 (10.91%) Retail
20 54 (10.91%) Oracle
20 54 (10.91%) SQL Server
21 53 (10.71%) Kubernetes
22 52 (10.51%) Java
23 51 (10.30%) Docker
24 50 (10.10%) Git
25 49 (9.90%) Scrum
25 49 (9.90%) AngularJS
26 48 (9.70%) GDPR

Senior Skill Set
Co-occurring Skills and Capabilities in Yorkshire by Category

The follow tables expand on the table above by listing co-occurrences grouped by category. The same employment type, locality and period is covered with up to 20 co-occurrences shown in each of the following categories:

Application Platforms
1 17 (3.43%) SAS
2 12 (2.42%) Confluence
3 8 (1.62%) JBoss
3 8 (1.62%) Red Hat Fuse
4 6 (1.21%) Apache
4 6 (1.21%) Apache Spark
4 6 (1.21%) Umbraco
5 5 (1.01%) CMS
6 3 (0.61%) nginx
6 3 (0.61%) SharePoint
7 2 (0.40%) Apache Airflow
7 2 (0.40%) IIS
Applications
1 13 (2.63%) Microsoft Excel
2 12 (2.42%) Microsoft Office
3 4 (0.81%) Microsoft PowerPoint
3 4 (0.81%) Trello
Business Applications
1 40 (8.08%) Oracle ERP
2 4 (0.81%) Unit4 Business World
3 3 (0.61%) SAP S/4HANA
4 2 (0.40%) Dynamics CRM
4 2 (0.40%) SAP GRC
5 1 (0.20%) iTrent
5 1 (0.20%) Oracle EBS
5 1 (0.20%) Oracle EBS R12
5 1 (0.20%) SAP ERP
Cloud Services
1 105 (21.21%) Azure
2 75 (15.15%) AWS
3 32 (6.46%) Azure DevOps
4 29 (5.86%) GCP
5 22 (4.44%) Power Platform
6 18 (3.64%) Serverless
7 17 (3.43%) SaaS
8 16 (3.23%) Microsoft 365
9 15 (3.03%) Cloud Computing
10 10 (2.02%) GitHub
11 9 (1.82%) OpenShift
12 6 (1.21%) PaaS
13 5 (1.01%) Amazon EKS
13 5 (1.01%) AWS Lambda
13 5 (1.01%) Entra ID
13 5 (1.01%) Google Play
13 5 (1.01%) PowerApps
14 4 (0.81%) Snowflake
15 3 (0.61%) Azure Monitor
15 3 (0.61%) Pulumi
Communications & Networking
1 25 (5.05%) Firewall
2 14 (2.83%) LAN
3 12 (2.42%) WAN
4 11 (2.22%) Internet
5 8 (1.62%) DHCP
5 8 (1.62%) F5 BIG-IP GTM
5 8 (1.62%) F5 BIG-IP LTM
6 7 (1.41%) DNS
6 7 (1.41%) VPN
7 6 (1.21%) Intrusion Detection
7 6 (1.21%) VLAN
8 5 (1.01%) Network Security
8 5 (1.01%) SAN
8 5 (1.01%) Wi-Fi
9 3 (0.61%) BGP
9 3 (0.61%) Cisco ASA
9 3 (0.61%) IPsec
9 3 (0.61%) MPLS
9 3 (0.61%) OSPF
9 3 (0.61%) VRRP
Database & Business Intelligence
1 54 (10.91%) SQL Server
2 42 (8.48%) Oracle Reports
3 30 (6.06%) PostgreSQL
4 22 (4.44%) MySQL
5 21 (4.24%) Power BI
6 13 (2.63%) Data Warehouse
6 13 (2.63%) Relational Database
7 9 (1.82%) Tableau
8 7 (1.41%) Oracle Database
9 6 (1.21%) Base SAS
9 6 (1.21%) Elasticsearch
9 6 (1.21%) Metadata
10 5 (1.01%) Oracle Database 11g
11 4 (0.81%) MongoDB
12 3 (0.61%) Amazon Redshift
12 3 (0.61%) BigQuery
12 3 (0.61%) Data Mining
12 3 (0.61%) Redis
12 3 (0.61%) Tableau Desktop
13 2 (0.40%) Data Lake
Development Applications
1 50 (10.10%) Git
2 31 (6.26%) Jenkins
3 19 (3.84%) JIRA
4 12 (2.42%) Bitbucket
5 8 (1.62%) CircleCI
5 8 (1.62%) IntelliJ
6 6 (1.21%) IBM UrbanCode
6 6 (1.21%) Selenium
7 5 (1.01%) SonarQube
8 4 (0.81%) Appium
8 4 (0.81%) fastlane
9 3 (0.61%) GitLab
9 3 (0.61%) Oracle Forms
10 2 (0.40%) Maven
10 2 (0.40%) PHPUnit
10 2 (0.40%) Team Foundation Server
10 2 (0.40%) Visual Studio
11 1 (0.20%) Cypress.io
11 1 (0.20%) Oracle APEX
11 1 (0.20%) TeamCity
General
1 147 (29.70%) Finance
2 104 (21.01%) Social Skills
3 62 (12.53%) Analytical Skills
4 54 (10.91%) Retail
5 45 (9.09%) Back Office
6 40 (8.08%) Banking
7 28 (5.66%) Public Sector
8 23 (4.65%) Inclusion and Diversity
9 21 (4.24%) Presentation Skills
10 16 (3.23%) Marketing
10 16 (3.23%) Tech for Good
11 10 (2.02%) Law
12 9 (1.82%) Games
13 7 (1.41%) Legal
13 7 (1.41%) Organisational Skills
13 7 (1.41%) Retail Banking
14 6 (1.21%) Manufacturing
14 6 (1.21%) Pharmaceutical
14 6 (1.21%) Retail Finance
15 4 (0.81%) Telecoms
Libraries, Frameworks & Software Standards
1 91 (18.38%) .NET
2 49 (9.90%) AngularJS
3 44 (8.89%) CSS
4 43 (8.69%) HTML
5 39 (7.88%) Oracle Fusion
6 34 (6.87%) React
7 29 (5.86%) .NET Core
8 24 (4.85%) RESTful
9 23 (4.65%) .NET Framework
9 23 (4.65%) Spring
9 23 (4.65%) Web Services
10 22 (4.44%) ASP.NET
11 20 (4.04%) Node.js
12 18 (3.64%) HTML5
13 17 (3.43%) XML
14 16 (3.23%) REST
14 16 (3.23%) Vue
15 13 (2.63%) Spring Boot
16 11 (2.22%) JSON
17 10 (2.02%) SOAP
Miscellaneous
1 38 (7.68%) Management Information System
2 21 (4.24%) Cloud Native
3 20 (4.04%) Virtual Team
4 19 (3.84%) Greenfield Project
5 18 (3.64%) Product Ownership
6 15 (3.03%) Data Centre
7 14 (2.83%) Self-Motivation
8 12 (2.42%) Driving Licence
9 11 (2.22%) Mobile App
10 9 (1.82%) Credit Risk
10 9 (1.82%) Public Cloud
11 7 (1.41%) Life Science
12 6 (1.21%) Algorithms
12 6 (1.21%) Data Structures
12 6 (1.21%) Distributed Systems
12 6 (1.21%) Onboarding
13 5 (1.01%) Genomics
13 5 (1.01%) mHealth
13 5 (1.01%) Security Operations Centre
14 4 (0.81%) Enterprise Software
Operating Systems
1 33 (6.67%) Windows
2 31 (6.26%) Linux
3 8 (1.62%) Android
3 8 (1.62%) Unix
4 5 (1.01%) Windows Server
5 3 (0.61%) Windows 10
6 2 (0.40%) Ubuntu
7 1 (0.20%) Debian
7 1 (0.20%) MVS
7 1 (0.20%) Windows Server 2012
Processes & Methodologies
1 185 (37.37%) Agile
2 99 (20.00%) Problem-Solving
3 84 (16.97%) CI/CD
4 82 (16.57%) DevOps
5 68 (13.74%) Software Engineering
6 60 (12.12%) ERP
7 56 (11.31%) ITIL
7 56 (11.31%) Mentoring
8 49 (9.90%) Scrum
9 48 (9.70%) Computer Science
10 47 (9.49%) People Management
11 44 (8.89%) Actionable Insight
12 40 (8.08%) Data Privacy
13 39 (7.88%) Lean Six Sigma
13 39 (7.88%) Six Sigma
14 37 (7.47%) Project Management
15 32 (6.46%) Collaborative Working
15 32 (6.46%) Project Delivery
16 30 (6.06%) Mathematics
16 30 (6.06%) Stakeholder Management
Programming Languages
1 115 (23.23%) SQL
2 70 (14.14%) C#
3 67 (13.54%) Python
4 58 (11.72%) JavaScript
5 52 (10.51%) Java
6 38 (7.68%) TypeScript
7 26 (5.25%) PL/SQL
8 17 (3.43%) PHP
9 11 (2.22%) PowerShell
10 10 (2.02%) R
10 10 (2.02%) VB.NET
11 8 (1.62%) Ruby
12 7 (1.41%) Bash
12 7 (1.41%) Kotlin
12 7 (1.41%) T-SQL
13 6 (1.21%) SAS Macro
14 5 (1.01%) C++
15 4 (0.81%) Groovy
16 3 (0.61%) Apex Code
16 3 (0.61%) C
Qualifications
1 107 (21.62%) Degree
2 42 (8.48%) Computer Science Degree
3 27 (5.45%) Security Cleared
4 20 (4.04%) SC Cleared
5 11 (2.22%) Postgraduate
6 7 (1.41%) Cisco Certification
6 7 (1.41%) DV Cleared
7 6 (1.21%) CISM
7 6 (1.21%) CISSP
7 6 (1.21%) TOGAF Certification
8 5 (1.01%) ACCA
8 5 (1.01%) Master's Degree
8 5 (1.01%) MCP
8 5 (1.01%) SSCP
9 4 (0.81%) CCNA
9 4 (0.81%) CISA
10 3 (0.61%) CCIE
10 3 (0.61%) CCNP
10 3 (0.61%) CCSA
10 3 (0.61%) Network+ Certification
Quality Assurance & Compliance
1 48 (9.70%) GDPR
2 40 (8.08%) Sarbanes-Oxley
3 22 (4.44%) QA
4 15 (3.03%) ISO/IEC 27001
5 12 (2.42%) NIST
6 11 (2.22%) GRC
7 9 (1.82%) IFRS
8 7 (1.41%) CRD IV
8 7 (1.41%) Cyber Essentials
9 6 (1.21%) CDISC
9 6 (1.21%) IFRS 9
10 4 (0.81%) Accessibility
10 4 (0.81%) GAAP
10 4 (0.81%) WCAG
11 3 (0.61%) Actionable Recommendations
12 2 (0.40%) SLA
13 1 (0.20%) COBIT
13 1 (0.20%) NCSC
13 1 (0.20%) PCI DSS
System Software
1 51 (10.30%) Docker
2 15 (3.03%) Active Directory
3 7 (1.41%) VMware Infrastructure
4 5 (1.01%) Firmware
5 4 (0.81%) Hyper-V
6 2 (0.40%) Virtual Servers
7 1 (0.20%) Embedded Firmware
7 1 (0.20%) Microsoft App-V
7 1 (0.20%) Terminal Services
7 1 (0.20%) Virtual Machines
7 1 (0.20%) VMware ESXi
7 1 (0.20%) vSphere
Systems Management
1 53 (10.71%) Kubernetes
2 34 (6.87%) Terraform
3 16 (3.23%) Ansible
4 6 (1.21%) Microsoft Intune
5 5 (1.01%) Prometheus
6 4 (0.81%) Progress Chef
7 3 (0.61%) Failover Clustering
7 3 (0.61%) Puppet
8 2 (0.40%) Grafana
8 2 (0.40%) N-central
9 1 (0.20%) HP Quality Center
9 1 (0.20%) Istio
9 1 (0.20%) Packer
9 1 (0.20%) Plesk
9 1 (0.20%) SCCM
Vendors
1 64 (12.93%) Microsoft
2 54 (10.91%) Oracle
3 35 (7.07%) NEC
4 29 (5.86%) Salesforce
5 22 (4.44%) Cisco
6 20 (4.04%) Google
7 12 (2.42%) Fortinet
7 12 (2.42%) VMware
8 11 (2.22%) CheckPoint
9 8 (1.62%) F5
9 8 (1.62%) IBM
9 8 (1.62%) ServiceNow
10 5 (1.01%) SAP
11 4 (0.81%) Juniper
11 4 (0.81%) New Relic
11 4 (0.81%) Palo Alto
11 4 (0.81%) Veracode
12 3 (0.61%) CA
12 3 (0.61%) OpenAI
12 3 (0.61%) Splunk