Analytics Jobs in the Midlands

Analytics
England > Midlands

The table below provides summary statistics for permanent job vacancies advertised in the Midlands requiring Analytics skills. It includes a benchmarking guide to the annual salaries offered in vacancies that cited Analytics over the 6 months leading up to 31 October 2024, comparing them to the same period in the previous two years.

6 months to
31 Oct 2024
Same period 2023 Same period 2022
Rank 55 49 25
Rank change year-on-year -6 -24 +9
Permanent jobs citing Analytics 347 277 1,003
As % of all permanent jobs advertised in the Midlands 3.74% 5.10% 8.91%
As % of the Processes & Methodologies category 4.57% 5.47% 9.25%
Number of salaries quoted 181 213 487
10th Percentile £36,250 £31,290 £35,500
25th Percentile £42,500 £38,750 £41,581
Median annual salary (50th Percentile) £57,500 £52,500 £50,950
Median % change year-on-year +9.52% +3.04% -2.95%
75th Percentile £71,250 £65,000 £72,125
90th Percentile £85,000 £70,950 £82,970
England median annual salary £70,000 £65,000 £67,500
% change year-on-year +7.69% -3.70% +3.85%

All Process and Methodology Skills
Midlands

Analytics falls under the Processes and Methodologies category. For comparison with the information above, the following table provides summary statistics for all permanent job vacancies requiring process or methodology skills in the Midlands.

Permanent vacancies with a requirement for process or methodology skills 7,588 5,067 10,841
As % of all permanent jobs advertised in the Midlands 81.88% 93.37% 96.30%
Number of salaries quoted 3,271 3,674 6,498
10th Percentile £30,000 £26,750 £30,500
25th Percentile £38,000 £36,500 £40,000
Median annual salary (50th Percentile) £52,000 £50,000 £50,000
Median % change year-on-year +4.00% - -
75th Percentile £66,050 £64,500 £66,250
90th Percentile £80,000 £77,500 £80,000
England median annual salary £60,000 £60,000 £60,000
% change year-on-year - - +3.45%

Analytics
Job Vacancy Trend in the Midlands

Job postings citing Analytics as a proportion of all IT jobs advertised in the Midlands.
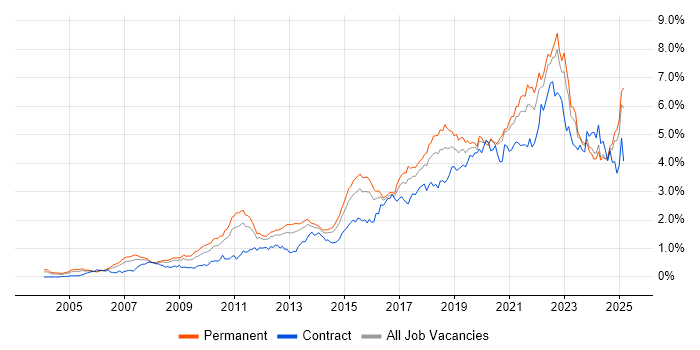
Job vacancy trend for Analytics in the Midlands

Analytics
Salary Trend in the Midlands

3-month moving average salary quoted in jobs citing Analytics in the Midlands.

Salary trend for Analytics in the Midlands

Analytics
Salary Histogram in the Midlands

Salary distribution for jobs citing Analytics in the Midlands over the 6 months to 31 October 2024.

Salary histogram for Analytics in the Midlands

Analytics
Job Locations in the Midlands

The table below looks at the demand and provides a guide to the median salaries quoted in IT jobs citing Analytics within the Midlands region over the 6 months to 31 October 2024. The 'Rank Change' column provides an indication of the change in demand within each location based on the same 6 month period last year.

Location Rank Change
on Same Period
Last Year
Matching
Permanent
IT Job Ads
Median Salary
Past 6 Months
Median Salary
% Change
on Same Period
Last Year
Live
Jobs
West Midlands 0 269 £60,000 +17.65% 104
East Midlands -37 77 £50,000 -10.31% 33
Analytics
England

Analytics
Co-occurring Skills and Capabilities in the Midlands by Category

The follow tables expand on the table above by listing co-occurrences grouped by category. The same employment type, locality and period is covered with up to 20 co-occurrences shown in each of the following categories:

Application Platforms
1 10 (2.88%) SharePoint
2 8 (2.31%) Microsoft Exchange
3 5 (1.44%) CMS
3 5 (1.44%) Confluence
4 4 (1.15%) Apache
4 4 (1.15%) Apache Spark
4 4 (1.15%) Headless CMS
5 3 (0.86%) Mule
5 3 (0.86%) SAS
6 2 (0.58%) Apache Airflow
6 2 (0.58%) ArcGIS
6 2 (0.58%) ThingWorx
6 2 (0.58%) WordPress
Applications
1 34 (9.80%) Microsoft Excel
2 10 (2.88%) Microsoft Office
3 5 (1.44%) Spreadsheet
4 4 (1.15%) Microsoft PowerPoint
5 2 (0.58%) Adobe Creative Suite
5 2 (0.58%) Adobe XD
5 2 (0.58%) MS Visio
5 2 (0.58%) Sketch
6 1 (0.29%) Adobe Illustrator
6 1 (0.29%) InDesign
6 1 (0.29%) Photoshop
Business Applications
1 8 (2.31%) Oracle EBS
1 8 (2.31%) Oracle ERP
1 8 (2.31%) PeopleSoft HCM
2 4 (1.15%) Dynamics NAV
2 4 (1.15%) NetSuite
2 4 (1.15%) Shopify
3 2 (0.58%) Dynamics CRM
3 2 (0.58%) SAP BPC
4 1 (0.29%) Payment Gateway
4 1 (0.29%) SAP ERP
4 1 (0.29%) SAP S/4HANA
Cloud Services
1 90 (25.94%) Power Platform
2 74 (21.33%) Azure
3 36 (10.37%) AWS
4 30 (8.65%) GCP
5 21 (6.05%) SaaS
6 18 (5.19%) Google Analytics
7 15 (4.32%) Azure Data Factory
7 15 (4.32%) Azure Synapse Analytics
7 15 (4.32%) Microsoft 365
8 9 (2.59%) Azure Stack
8 9 (2.59%) OCI
9 6 (1.73%) Google Tag Manager
10 5 (1.44%) Azure DevOps
10 5 (1.44%) Azure Monitor
11 4 (1.15%) Cloud Computing
11 4 (1.15%) Google Ads
11 4 (1.15%) OneDrive
11 4 (1.15%) Salesforce Sales Cloud
11 4 (1.15%) Salesforce Service Cloud
12 3 (0.86%) PaaS
Communications & Networking
1 26 (7.49%) Broadband
2 18 (5.19%) WAN
3 11 (3.17%) Firewall
4 10 (2.88%) LAN
4 10 (2.88%) SD-WAN
5 9 (2.59%) VPN
5 9 (2.59%) Wireless
6 6 (1.73%) Cisco Firepower
6 6 (1.73%) Network Security
7 5 (1.44%) DHCP
7 5 (1.44%) DNS
7 5 (1.44%) EIGRP
7 5 (1.44%) Frame Relay
7 5 (1.44%) IPv6
7 5 (1.44%) MPLS
7 5 (1.44%) Multicast
7 5 (1.44%) OSPF
7 5 (1.44%) SNMP
7 5 (1.44%) WAAS
7 5 (1.44%) Wireless Security
Database & Business Intelligence
1 85 (24.50%) Power BI
2 50 (14.41%) Data Warehouse
3 29 (8.36%) SQL Server
4 27 (7.78%) SQL Server Integration Services
5 26 (7.49%) Data Hub
6 22 (6.34%) Tableau
7 20 (5.76%) BusinessObjects
8 15 (4.32%) SQL Server Reporting Services
9 14 (4.03%) Data Lake
10 11 (3.17%) Big Data
10 11 (3.17%) SQL Server Analysis Services
11 8 (2.31%) Oracle Reports
11 8 (2.31%) Relational Database
12 7 (2.02%) Azure SQL Database
13 6 (1.73%) MySQL
13 6 (1.73%) Power Query
14 5 (1.44%) Azure SQL Data Warehouse
14 5 (1.44%) Metadata
15 4 (1.15%) Data Mining
15 4 (1.15%) Microsoft Analysis Services
Development Applications
1 12 (3.46%) Git
2 5 (1.44%) JIRA
3 1 (0.29%) ERwin
3 1 (0.29%) Postman
3 1 (0.29%) PowerDesigner
3 1 (0.29%) Visual Studio
General
1 130 (37.46%) Social Skills
2 100 (28.82%) Analytical Skills
3 61 (17.58%) Finance
4 42 (12.10%) Marketing
5 34 (9.80%) Retail
6 31 (8.93%) Influencing Skills
7 21 (6.05%) Inclusion and Diversity
7 21 (6.05%) Presentation Skills
8 17 (4.90%) Legal
9 13 (3.75%) Law
9 13 (3.75%) Public Sector
10 12 (3.46%) Organisational Skills
11 11 (3.17%) Manufacturing
12 9 (2.59%) Pharmaceutical
12 9 (2.59%) Telecoms
13 8 (2.31%) Advertising
14 7 (2.02%) Banking
14 7 (2.02%) Electronics
15 4 (1.15%) Local Government
16 2 (0.58%) Automotive
Job Titles
1 104 (29.97%) Analyst
2 88 (25.36%) Senior
3 53 (15.27%) Senior Analyst
4 41 (11.82%) Data Analyst
5 39 (11.24%) Developer
6 36 (10.37%) Data Engineer
7 18 (5.19%) Audit Analyst
7 18 (5.19%) Data Manager
7 18 (5.19%) IT Analyst
8 17 (4.90%) Architect
9 16 (4.61%) Consultant
10 15 (4.32%) Analytics Manager
11 14 (4.03%) Data Analytics Manager
12 13 (3.75%) Data Scientist
12 13 (3.75%) Lead
13 12 (3.46%) Senior Data Analyst
14 11 (3.17%) Digital Analyst
14 11 (3.17%) Product Manager
15 10 (2.88%) Pricing Analyst
16 9 (2.59%) Senior Developer
Libraries, Frameworks & Software Standards
1 18 (5.19%) HTML
2 14 (4.03%) CSS
3 9 (2.59%) .NET
4 8 (2.31%) Oracle Fusion
4 8 (2.31%) REST
5 7 (2.02%) Web Services
6 5 (1.44%) .NET Framework
6 5 (1.44%) SOAP
6 5 (1.44%) Twitter Bootstrap
7 4 (1.15%) .NET Core
7 4 (1.15%) Ajax
7 4 (1.15%) AngularJS
7 4 (1.15%) GraphQL
7 4 (1.15%) JSON
7 4 (1.15%) Kafka
7 4 (1.15%) NumPy
7 4 (1.15%) XML
8 3 (0.86%) React
8 3 (0.86%) RESTful
9 2 (0.58%) PostGIS
Miscellaneous
1 17 (4.90%) Management Information System
2 10 (2.88%) Algorithms
2 10 (2.88%) Social Media
3 9 (2.59%) Analytical Mindset
3 9 (2.59%) Data Centre
3 9 (2.59%) Onboarding
3 9 (2.59%) Pricing Data
3 9 (2.59%) Robotics
4 8 (2.31%) Credit Risk
4 8 (2.31%) Enterprise Software
5 7 (2.02%) Product Ownership
6 5 (1.44%) IoT
6 5 (1.44%) Linux Command Line
6 5 (1.44%) Self-Motivation
7 4 (1.15%) Data Protection Act
7 4 (1.15%) PMI
8 3 (0.86%) Graphic Design
8 3 (0.86%) Greenfield Project
8 3 (0.86%) NHS
8 3 (0.86%) Reference Data
Operating Systems
1 12 (3.46%) Linux
2 8 (2.31%) Windows
3 4 (1.15%) Oracle Linux
3 4 (1.15%) Ubuntu
3 4 (1.15%) Windows 10
3 4 (1.15%) Windows Server
3 4 (1.15%) Windows Server 2008
3 4 (1.15%) Windows Server 2012
3 4 (1.15%) Windows Server 2016
Processes & Methodologies
1 105 (30.26%) Business Intelligence
2 99 (28.53%) Problem-Solving
3 79 (22.77%) Data Analytics
3 79 (22.77%) Data Management
4 68 (19.60%) Decision-Making
5 65 (18.73%) Visualisation
6 64 (18.44%) Data Analysis
7 63 (18.16%) Continuous Improvement
8 61 (17.58%) Data Governance
9 58 (16.71%) Agile
10 44 (12.68%) Data Modelling
11 43 (12.39%) Data Visualisation
12 42 (12.10%) Roadmaps
13 41 (11.82%) Data Science
14 38 (10.95%) Data Transformation
15 36 (10.37%) Customer Experience
15 36 (10.37%) ETL
15 36 (10.37%) Machine Learning
16 35 (10.09%) Actionable Insight
16 35 (10.09%) Data Strategy
Programming Languages
1 118 (34.01%) SQL
2 56 (16.14%) Python
3 16 (4.61%) Data Analysis Expressions
3 16 (4.61%) T-SQL
4 14 (4.03%) R
5 12 (3.46%) JavaScript
6 11 (3.17%) C++
7 8 (2.31%) C#
8 7 (2.02%) PHP
9 5 (1.44%) Bash
9 5 (1.44%) Bicep
9 5 (1.44%) Java
9 5 (1.44%) VBA
10 4 (1.15%) Apex Code
10 4 (1.15%) PowerShell
11 1 (0.29%) ABAP
11 1 (0.29%) C
11 1 (0.29%) RPG
11 1 (0.29%) SOQL
11 1 (0.29%) VB.NET
Qualifications
1 77 (22.19%) Degree
2 28 (8.07%) CISA
3 16 (4.61%) Cisco Certification
3 16 (4.61%) Computer Science Degree
4 10 (2.88%) DBS Check
5 9 (2.59%) CCNA
6 8 (2.31%) CCNP
6 8 (2.31%) Microsoft Certification
7 6 (1.73%) Azure Certification
7 6 (1.73%) Security Cleared
8 5 (1.44%) CCIE
8 5 (1.44%) CISSP
8 5 (1.44%) Master's Degree
9 4 (1.15%) Oracle Certification
9 4 (1.15%) PMI Certification
10 3 (0.86%) MCSE
11 2 (0.58%) ACCA
11 2 (0.58%) CIMA
11 2 (0.58%) CISM
11 2 (0.58%) GIAC
Quality Assurance & Compliance
1 41 (11.82%) Data Quality
2 27 (7.78%) Sarbanes-Oxley
3 17 (4.90%) QA
4 11 (3.17%) Accessibility
5 8 (2.31%) GDPR
6 4 (1.15%) ISO/IEC 27001
7 3 (0.86%) WCAG
8 2 (0.58%) IFRS
8 2 (0.58%) IFRS 9
8 2 (0.58%) PCI DSS
8 2 (0.58%) SLA
9 1 (0.29%) Actionable Recommendations
System Software
1 13 (3.75%) Active Directory
2 9 (2.59%) Hyper-V
2 9 (2.59%) VMware Infrastructure
3 4 (1.15%) Terminal Services
4 3 (0.86%) Docker
Systems Management
1 12 (3.46%) Terraform
2 6 (1.73%) Stealthwatch
3 4 (1.15%) Proxmox
4 3 (0.86%) Ansible
4 3 (0.86%) Kubernetes
4 3 (0.86%) Nessus
5 2 (0.58%) Docker Swarm
5 2 (0.58%) Microsoft Intune
Vendors
1 95 (27.38%) Microsoft
2 43 (12.39%) Google
3 30 (8.65%) Databricks
4 25 (7.20%) SAP
5 23 (6.63%) Oracle
6 17 (4.90%) Cisco
7 13 (3.75%) Salesforce
8 10 (2.88%) Adobe
9 9 (2.59%) VMware
10 8 (2.31%) BT
10 8 (2.31%) Hyperion
10 8 (2.31%) JD Edwards
10 8 (2.31%) PeopleSoft
11 6 (1.73%) Apple
11 6 (1.73%) Meraki
12 5 (1.44%) HP
13 4 (1.15%) ServiceNow
14 3 (0.86%) Ahrefs
14 3 (0.86%) Ruckus Wireless
14 3 (0.86%) Screaming Frog