Business Intelligence Contract Job Trends in Bristol

Business Intelligence (BI)
South West > Bristol

The table below provides summary statistics and contractor rates for jobs advertised in Bristol requiring Business Intelligence skills. It covers contract job vacancies from the 6 months leading up to 4 October 2025, with comparisons to the same periods in the previous two years.

6 months to
4 Oct 2025
Same period 2024 Same period 2023
Rank 26 26 20
Rank change year-on-year 0 -6 +2
Contract jobs citing Business Intelligence 48 56 74
As % of all contract jobs in Bristol 6.53% 6.29% 7.09%
As % of the Processes & Methodologies category 7.08% 7.57% 8.17%
Number of daily rates quoted 28 39 59
10th Percentile £290 £350 £412
25th Percentile £391 £410 £425
Median daily rate (50th Percentile) £475 £488 £550
Median % change year-on-year -2.56% -11.36% +22.22%
75th Percentile £542 £625 £630
90th Percentile £597 £778 £688
South West median daily rate £475 £529 £550
% change year-on-year -10.12% -3.91% +4.76%
Number of hourly rates quoted 2 2 2
10th Percentile £35.38 - £51.63
25th Percentile £41.56 £25.26 £52.19
Median hourly rate £53.75 £27.13 £53.75
Median % change year-on-year +98.16% -49.53% -
75th Percentile £66.56 £28.99 £54.69
90th Percentile £73.13 - £54.88
South West median hourly rate £25.70 £27.13 £55.00
% change year-on-year -5.25% -50.68% -

All Process and Methodology Skills
Bristol

Business Intelligence falls under the Processes and Methodologies category. For comparison with the information above, the following table provides summary statistics for all contract job vacancies requiring process or methodology skills in Bristol.

Contract vacancies with a requirement for process or methodology skills 678 740 906
As % of all contract IT jobs advertised in Bristol 92.24% 83.15% 86.78%
Number of daily rates quoted 331 389 600
10th Percentile £250 £268 £307
25th Percentile £378 £400 £413
Median daily rate (50th Percentile) £488 £488 £525
Median % change year-on-year - -7.14% +5.00%
75th Percentile £600 £590 £646
90th Percentile £750 £725 £725
South West median daily rate £508 £525 £550
% change year-on-year -3.24% -4.55% +4.76%
Number of hourly rates quoted 152 137 118
10th Percentile £13.04 £46.30 £24.28
25th Percentile £18.87 £63.75 £50.00
Median hourly rate £33.00 £70.00 £65.00
Median % change year-on-year -52.86% +7.69% -
75th Percentile £65.00 £72.50 £79.06
90th Percentile £69.88 £77.50 £83.51
South West median hourly rate £25.15 £67.50 £60.00
% change year-on-year -62.74% +12.50% -

Business Intelligence
Job Vacancy Trend in Bristol

Historical trend showing the proportion of contract IT job postings citing Business Intelligence relative to all contract IT jobs advertised in Bristol.
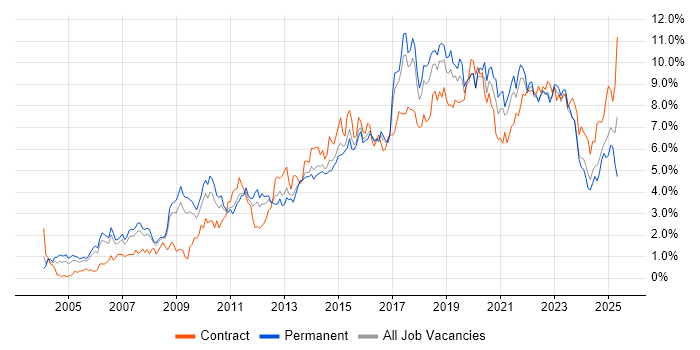
Business Intelligence job vacancy trend in Bristol

Business Intelligence
Daily Rate Trend in Bristol

Contractor daily rate distribution trend for jobs in Bristol citing Business Intelligence.

Contractor daily rate distribution trend for jobs in Bristol citing Business Intelligence

Business Intelligence
Daily Rate Histogram in Bristol

Daily rate distribution for jobs citing Business Intelligence in Bristol over the 6 months to 4 October 2025.

Daily rate histogram for Business Intelligence in Bristol

Business Intelligence
Hourly Rate Trend in Bristol

Contractor hourly rate distribution trend for jobs in Bristol citing Business Intelligence.

Contractor hourly rate distribution trend for jobs in Bristol citing Business Intelligence

Business Intelligence
Hourly Rate Histogram in Bristol

Hourly rate distribution of jobs citing Business Intelligence in Bristol over the 6 months to 4 October 2025.

Hourly rate histogram for Business Intelligence in Bristol

Business Intelligence
Co-Occurring Skills & Capabilities in Bristol by Category

The following tables expand on the one above by listing co-occurrences grouped by category. They cover the same employment type, locality and period, with up to 20 co-occurrences shown in each category:

Application Platforms
1 6 (12.50%) Oracle Application Server
2 4 (8.33%) SharePoint
3 1 (2.08%) Apache
3 1 (2.08%) Apache Spark
Applications
1 7 (14.58%) Microsoft Excel
1 7 (14.58%) Microsoft PowerPoint
2 3 (6.25%) Microsoft Project
3 2 (4.17%) Spreadsheet
4 1 (2.08%) Microsoft Office
Business Applications
1 2 (4.17%) Dynamics CRM
Cloud Services
1 32 (66.67%) Power Platform
2 9 (18.75%) AWS
2 9 (18.75%) Azure
2 9 (18.75%) Snowflake
3 4 (8.33%) GCP
3 4 (8.33%) Microsoft Copilot
4 3 (6.25%) Azure DevOps
4 3 (6.25%) Power Automate
5 2 (4.17%) Microsoft 365
6 1 (2.08%) Matillion
Communications & Networking
1 2 (4.17%) DNS
1 2 (4.17%) LAN
1 2 (4.17%) VoIP
1 2 (4.17%) Wi-Fi
Database & Business Intelligence
1 32 (66.67%) Power BI
2 7 (14.58%) Data Warehouse
3 6 (12.50%) Oracle ODI
3 6 (12.50%) PostgreSQL
4 5 (10.42%) Oracle Reports
4 5 (10.42%) Star Schema
5 4 (8.33%) Power Query
6 3 (6.25%) Big Data
7 2 (4.17%) BigQuery
7 2 (4.17%) Oracle Database
8 1 (2.08%) Elasticsearch
8 1 (2.08%) Hadoop
8 1 (2.08%) Looker
8 1 (2.08%) Metadata
8 1 (2.08%) Relational Database
8 1 (2.08%) SQL Server
8 1 (2.08%) SQL Server Analysis Services
8 1 (2.08%) SQL Server Integration Services
8 1 (2.08%) SQL Server Reporting Services
8 1 (2.08%) Tableau
Development Applications
1 5 (10.42%) DBeaver
2 3 (6.25%) JIRA
3 1 (2.08%) GitLab
3 1 (2.08%) Rational DOORS
General
1 18 (37.50%) Finance
2 14 (29.17%) Manufacturing
2 14 (29.17%) Social Skills
3 13 (27.08%) Marketing
3 13 (27.08%) Public Sector
4 11 (22.92%) Electronics
4 11 (22.92%) Telecoms
5 9 (18.75%) Analytical Skills
6 5 (10.42%) Organisational Skills
7 4 (8.33%) Documentation Skills
8 3 (6.25%) Banking
8 3 (6.25%) Polish Language
9 2 (4.17%) Influencing Skills
9 2 (4.17%) Tech for Good
10 1 (2.08%) Aerospace
10 1 (2.08%) Law
10 1 (2.08%) Presentation Skills
Job Titles
1 12 (25.00%) Lead
2 8 (16.67%) Analyst
2 8 (16.67%) Data Engineer
2 8 (16.67%) Developer
3 6 (12.50%) Senior
4 5 (10.42%) Business Intelligence Developer
4 5 (10.42%) Power BI Developer
4 5 (10.42%) Quality Engineer
5 4 (8.33%) Data Analyst
5 4 (8.33%) Test Analyst
6 3 (6.25%) .NET Developer
6 3 (6.25%) C# Developer
6 3 (6.25%) Lead .NET Developer
6 3 (6.25%) Lead C# Developer
6 3 (6.25%) Lead Developer
6 3 (6.25%) Project Officer
6 3 (6.25%) Security Manager
6 3 (6.25%) Senior .NET Developer
6 3 (6.25%) Senior C# Developer
6 3 (6.25%) Senior Developer
Libraries, Frameworks & Software Standards
1 5 (10.42%) Oracle GoldenGate
2 4 (8.33%) .NET
3 3 (6.25%) .NET Core
4 2 (4.17%) Elastic Stack
5 1 (2.08%) Apache NiFi
5 1 (2.08%) Kafka
5 1 (2.08%) React
Miscellaneous
1 5 (10.42%) Replication
2 3 (6.25%) Onboarding
2 3 (6.25%) Product Ownership
2 3 (6.25%) Self-Motivation
3 2 (4.17%) AI Agents
3 2 (4.17%) Hybrid Cloud
3 2 (4.17%) Low-Code
4 1 (2.08%) Industrial Internet of Things
Operating Systems
1 4 (8.33%) Windows
2 2 (4.17%) Android
2 2 (4.17%) Apple iOS
2 2 (4.17%) Mac OS
3 1 (2.08%) Linux
3 1 (2.08%) Windows Server
Processes & Methodologies
1 16 (33.33%) Agile
2 11 (22.92%) Analytics
2 11 (22.92%) Digital Marketing
2 11 (22.92%) Programme Management
3 10 (20.83%) Artificial Intelligence
3 10 (20.83%) ETL
4 7 (14.58%) Problem-Solving
5 6 (12.50%) CI/CD
5 6 (12.50%) Dashboard Development
5 6 (12.50%) Data Analysis
5 6 (12.50%) Decision-Making
5 6 (12.50%) Mentoring
5 6 (12.50%) Project Management
5 6 (12.50%) Storytelling
6 5 (10.42%) Change Management
6 5 (10.42%) Dimensional Modelling
6 5 (10.42%) Project Delivery
6 5 (10.42%) Stakeholder Management
6 5 (10.42%) Test Automation
7 4 (8.33%) Customer Service
Programming Languages
1 16 (33.33%) SQL
2 12 (25.00%) Python
3 5 (10.42%) C#
4 3 (6.25%) Data Analysis Expressions
4 3 (6.25%) PowerShell
5 1 (2.08%) Bash
5 1 (2.08%) JavaScript
5 1 (2.08%) PL/SQL
5 1 (2.08%) SAPscript
5 1 (2.08%) TypeScript
5 1 (2.08%) VBA
Qualifications
1 9 (18.75%) Security Cleared
2 8 (16.67%) SC Cleared
3 2 (4.17%) ISTQB
3 2 (4.17%) ISTQB Foundation Certification
4 1 (2.08%) Degree
4 1 (2.08%) DV Cleared
Quality Assurance & Compliance
1 6 (12.50%) Data Quality
2 5 (10.42%) PMO
3 2 (4.17%) Accessibility
4 1 (2.08%) SLA
System Software
1 2 (4.17%) Docker
Systems Management
1 4 (8.33%) Terraform
2 2 (4.17%) Kubernetes
3 1 (2.08%) Ansible
3 1 (2.08%) Data Guard
3 1 (2.08%) Grafana
3 1 (2.08%) Kibana
3 1 (2.08%) logstash
3 1 (2.08%) Oracle Enterprise Manager
3 1 (2.08%) Oracle RMAN
3 1 (2.08%) Prometheus
Vendors
1 13 (27.08%) SAP
2 12 (25.00%) Microsoft
3 7 (14.58%) Oracle
4 2 (4.17%) Google
5 1 (2.08%) Cognos
5 1 (2.08%) Databricks
5 1 (2.08%) IBM
5 1 (2.08%) Salesforce