Security Cleared Contracts in Bristol

Security Clearance
South West > Bristol

The table below provides summary statistics for contract job vacancies advertised in Bristol with a requirement for Security Cleared qualifications. It includes a benchmarking guide to the contractor rates offered over the 6 months leading up to 1 May 2025, comparing them to the same period in the previous two years.

6 months to
1 May 2025
Same period 2024 Same period 2023
Rank 1 1 1
Rank change year-on-year 0 0 0
Contract jobs citing Security Cleared 208 408 391
As % of all contract jobs advertised in Bristol 38.73% 38.60% 31.16%
As % of the Qualifications category 81.57% 83.27% 82.14%
Number of daily rates quoted 91 206 254
10th Percentile £361 £375 £353
25th Percentile £444 £488 £513
Median daily rate (50th Percentile) £515 £575 £600
Median % change year-on-year -10.43% -4.17% +14.29%
75th Percentile £608 £650 £675
90th Percentile £688 £725 £743
South West median daily rate £563 £550 £590
% change year-on-year +2.27% -6.78% +12.38%
Number of hourly rates quoted 53 109 63
10th Percentile £18.51 £43.75 £30.11
25th Percentile £31.25 £62.50 £57.25
Median hourly rate £65.00 £70.00 £65.00
Median % change year-on-year -7.14% +7.69% -
75th Percentile £68.00 £77.50 £85.00
90th Percentile £75.00 £85.00 £91.73
South West median hourly rate £60.00 £70.00 £65.25
% change year-on-year -14.29% +7.28% +1.10%

All Academic and Professional Certifications
Bristol

Security Cleared falls under the Academic Qualifications and Professional Certifications category. For comparison with the information above, the following table provides summary statistics for all contract job vacancies requiring academic qualifications or professional certifications in Bristol.

Contract vacancies requiring academic qualifications or professional certifications 255 490 476
As % of all contract IT jobs advertised in Bristol 47.49% 46.36% 37.93%
Number of daily rates quoted 134 240 306
10th Percentile £240 £311 £303
25th Percentile £366 £463 £475
Median daily rate (50th Percentile) £456 £566 £576
Median % change year-on-year -19.47% -1.74% +10.82%
75th Percentile £587 £650 £675
90th Percentile £679 £725 £739
South West median daily rate £550 £550 £578
% change year-on-year - -4.76% +11.06%
Number of hourly rates quoted 54 118 75
10th Percentile £18.51 £43.75 £30.21
25th Percentile £31.56 £54.74 £57.25
Median hourly rate £64.50 £70.00 £65.00
Median % change year-on-year -7.86% +7.69% -
75th Percentile £68.00 £76.88 £85.00
90th Percentile £75.00 £85.00 £89.10
South West median hourly rate £60.00 £61.00 £65.00
% change year-on-year -1.64% -6.15% +5.69%

Security Cleared
Job Vacancy Trend in Bristol

Job postings citing Security Cleared as a proportion of all IT jobs advertised in Bristol.
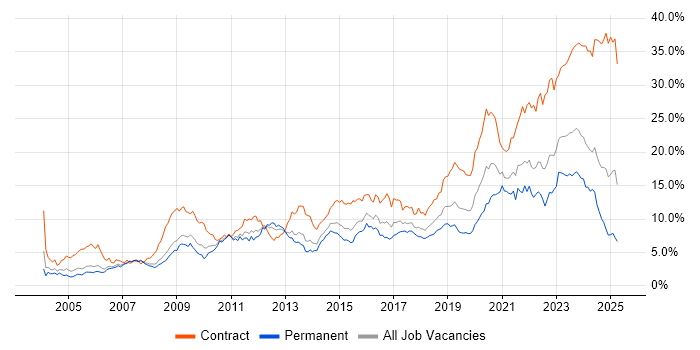
Job vacancy trend for Security Cleared in Bristol

Security Cleared
Contractor Daily Rate Trend in Bristol

3-month moving average daily rate quoted in jobs citing Security Cleared in Bristol.

Daily rate trend for Security Cleared in Bristol

Security Cleared
Daily Rate Histogram in Bristol

Daily rate distribution for jobs citing Security Cleared in Bristol over the 6 months to 1 May 2025.

Daily rate histogram for Security Cleared in Bristol

Security Cleared
Contractor Hourly Rate Trend in Bristol

3-month moving average hourly rates quoted in jobs citing Security Cleared in Bristol.

Hourly rate trend for Security Cleared in Bristol

Security Cleared
Hourly Rate Histogram in Bristol

Hourly rate distribution of jobs citing Security Cleared in Bristol over the 6 months to 1 May 2025.

Hourly rate histogram for Security Cleared in Bristol

Security Cleared
Co-occurring Skills and Capabilities in Bristol by Category

The follow tables expand on the table above by listing co-occurrences grouped by category. The same employment type, locality and period is covered with up to 20 co-occurrences shown in each of the following categories:

Application Platforms
1 4 (1.92%) Apache
2 1 (0.48%) Apache Spark
2 1 (0.48%) Confluence
2 1 (0.48%) WebSphere
Applications
1 6 (2.88%) Microsoft Excel
2 5 (2.40%) Microsoft Project
3 2 (0.96%) Microsoft PowerPoint
4 1 (0.48%) CATIA
4 1 (0.48%) Microsoft Office
4 1 (0.48%) Simulink
4 1 (0.48%) Spreadsheet
4 1 (0.48%) Windchill
Business Applications
1 5 (2.40%) Primavera
2 2 (0.96%) Teamcenter
3 1 (0.48%) Misys Midas
3 1 (0.48%) Oracle ERP
3 1 (0.48%) SAP PS
Cloud Services
1 15 (7.21%) AWS
2 13 (6.25%) Azure
3 10 (4.81%) SaaS
4 9 (4.33%) PaaS
5 7 (3.37%) Microsoft 365
6 5 (2.40%) OpenShift
7 3 (1.44%) GCP
7 3 (1.44%) Power Platform
8 2 (0.96%) Amazon ELB
8 2 (0.96%) AWS CloudFormation
8 2 (0.96%) Azure App Service
8 2 (0.96%) Azure ExpressRoute
8 2 (0.96%) Azure Storage
8 2 (0.96%) IaaS
8 2 (0.96%) OCI
9 1 (0.48%) Amazon EC2
9 1 (0.48%) Amazon S3
9 1 (0.48%) Azure DevOps
9 1 (0.48%) Cloud Computing
9 1 (0.48%) GitHub
Communications & Networking
1 21 (10.10%) Firewall
2 13 (6.25%) WAN
3 12 (5.77%) Network Security
4 11 (5.29%) PBX
4 11 (5.29%) VoIP
5 10 (4.81%) LAN
6 8 (3.85%) 5G
7 5 (2.40%) 4G
7 5 (2.40%) Unified Communications
8 4 (1.92%) DNS
8 4 (1.92%) LTE
9 3 (1.44%) BGP
9 3 (1.44%) ISDN
9 3 (1.44%) OSPF
9 3 (1.44%) SD-WAN
10 2 (0.96%) 2G
10 2 (0.96%) Cisco ASA
10 2 (0.96%) MPLS
10 2 (0.96%) TCP/IP
10 2 (0.96%) Wireless
Database & Business Intelligence
1 3 (1.44%) Data Warehouse
1 3 (1.44%) MongoDB
1 3 (1.44%) Power BI
2 2 (0.96%) Elasticsearch
2 2 (0.96%) Redis
2 2 (0.96%) Tableau
3 1 (0.48%) Amazon RDS
3 1 (0.48%) CockroachDB
3 1 (0.48%) DB2
3 1 (0.48%) Geospatial Data
3 1 (0.48%) Hadoop
3 1 (0.48%) MySQL
3 1 (0.48%) NoSQL
3 1 (0.48%) Oracle Database
3 1 (0.48%) PostgreSQL
Development Applications
1 7 (3.37%) Git
2 6 (2.88%) Jenkins
3 4 (1.92%) Rational DOORS
4 3 (1.44%) JIRA
5 2 (0.96%) GitLab
6 1 (0.48%) Artifactory
6 1 (0.48%) Axure RP
6 1 (0.48%) Flyway
6 1 (0.48%) MLflow
6 1 (0.48%) Oracle APEX
6 1 (0.48%) Rational Rhapsody
General
1 36 (17.31%) Public Sector
2 33 (15.87%) Social Skills
3 18 (8.65%) Finance
3 18 (8.65%) Telecoms
4 8 (3.85%) Analytical Skills
4 8 (3.85%) Manufacturing
5 7 (3.37%) Military
6 6 (2.88%) Aerospace
7 5 (2.40%) Legal
8 4 (1.92%) Marketing
9 3 (1.44%) Billing
9 3 (1.44%) Electronics
9 3 (1.44%) Presentation Skills
10 2 (0.96%) Aviation
10 2 (0.96%) Banking
10 2 (0.96%) Influencing Skills
10 2 (0.96%) Law
11 1 (0.48%) Documentation Skills
11 1 (0.48%) Organisational Skills
11 1 (0.48%) Polish Language
Job Titles
1 46 (22.12%) Architect
2 18 (8.65%) Software Engineer
3 14 (6.73%) Analyst
4 12 (5.77%) Technical Architect
5 11 (5.29%) Developer
5 11 (5.29%) Network Architect
6 10 (4.81%) Project Manager
7 9 (4.33%) Ada Engineer
7 9 (4.33%) Ada Software Engineer
7 9 (4.33%) Network Technical Architect
8 8 (3.85%) Embedded Engineer
8 8 (3.85%) Embedded Software Engineer
9 7 (3.37%) Consultant
9 7 (3.37%) Infrastructure Architect
10 6 (2.88%) Data Engineer
10 6 (2.88%) Delivery Manager
10 6 (2.88%) Enterprise Architect
10 6 (2.88%) Lead
10 6 (2.88%) Project Planner
10 6 (2.88%) Solutions Architect
Libraries, Frameworks & Software Standards
1 13 (6.25%) Middleware
2 7 (3.37%) OpenID
2 7 (3.37%) Qt
3 6 (2.88%) FastAPI
4 4 (1.92%) Kafka
5 3 (1.44%) Apache NiFi
5 3 (1.44%) PyTorch
6 2 (0.96%) ARM Templates
6 2 (0.96%) CSS
6 2 (0.96%) Elastic Stack
6 2 (0.96%) HTML
6 2 (0.96%) Hugging Face
7 1 (0.48%) Angular 2
7 1 (0.48%) AngularJS
7 1 (0.48%) EntireX
7 1 (0.48%) HTML5
7 1 (0.48%) LAMP
7 1 (0.48%) Node.js
7 1 (0.48%) REST
7 1 (0.48%) TensorFlow
Miscellaneous
1 10 (4.81%) Data Centre
2 9 (4.33%) Onboarding
3 7 (3.37%) Video Conferencing
4 6 (2.88%) Blackberry
4 6 (2.88%) Management Information System
4 6 (2.88%) Product Ownership
5 5 (2.40%) Self-Motivation
6 4 (1.92%) Driving Licence
6 4 (1.92%) Replication
7 3 (1.44%) Algorithms
7 3 (1.44%) IVR
7 3 (1.44%) Linux Command Line
8 1 (0.48%) CESG
8 1 (0.48%) Clustering
8 1 (0.48%) Data Structures
8 1 (0.48%) Enterprise Cloud
8 1 (0.48%) PKI
8 1 (0.48%) Public Cloud
8 1 (0.48%) Security Operations Centre
8 1 (0.48%) Virtual Team
Operating Systems
1 32 (15.38%) Linux
2 18 (8.65%) Windows
3 5 (2.40%) Windows 7
4 3 (1.44%) Ubuntu
5 2 (0.96%) Red Hat Enterprise Linux
5 2 (0.96%) Windows 10
6 1 (0.48%) Windows Server
6 1 (0.48%) Windows Server 2003
6 1 (0.48%) Windows Server 2012
Processes & Methodologies
1 27 (12.98%) Software Engineering
2 23 (11.06%) Project Management
3 20 (9.62%) Problem-Solving
4 18 (8.65%) DevOps
4 18 (8.65%) Project Delivery
5 17 (8.17%) Agile
5 17 (8.17%) Migration
6 16 (7.69%) Roadmaps
6 16 (7.69%) Validation
7 13 (6.25%) Commercial Awareness
7 13 (6.25%) Technical Leadership
8 12 (5.77%) CI/CD
8 12 (5.77%) Collaborative Working
9 11 (5.29%) Containerisation
9 11 (5.29%) Cybersecurity
9 11 (5.29%) ITIL
9 11 (5.29%) Network Architecture
9 11 (5.29%) Stakeholder Management
9 11 (5.29%) Systems Engineering
10 10 (4.81%) SysML
Programming Languages
1 23 (11.06%) Ada
2 22 (10.58%) Python
3 12 (5.77%) SQL
4 11 (5.29%) Bash
4 11 (5.29%) C++
5 7 (3.37%) C#
6 6 (2.88%) JavaScript
7 5 (2.40%) Java
8 4 (1.92%) C
8 4 (1.92%) Perl
8 4 (1.92%) PL/SQL
8 4 (1.92%) Shell Script
9 3 (1.44%) PowerShell
10 2 (0.96%) Bicep
11 1 (0.48%) Data Analysis Expressions
11 1 (0.48%) Fortran
11 1 (0.48%) MATLAB
11 1 (0.48%) PHP
11 1 (0.48%) R
11 1 (0.48%) TypeScript
Qualifications
1 143 (68.75%) SC Cleared
2 44 (21.15%) DV Cleared
3 11 (5.29%) CCNP
3 11 (5.29%) Cisco Certification
4 8 (3.85%) Degree
5 6 (2.88%) VMware Certified Professional (VCP)
6 5 (2.40%) BPSS Clearance
6 5 (2.40%) CCNA
6 5 (2.40%) CISM
6 5 (2.40%) CISSP
7 4 (1.92%) CISA
7 4 (1.92%) Microsoft Certification
8 3 (1.44%) ISACA
9 2 (0.96%) CCIE
9 2 (0.96%) CRISC
9 2 (0.96%) PRINCE2 Practitioner
9 2 (0.96%) RIBA
9 2 (0.96%) TOGAF Certification
10 1 (0.48%) Computer Science Degree
10 1 (0.48%) Master's Degree
Quality Assurance & Compliance
1 20 (9.62%) Def Stans
2 11 (5.29%) IEC 61508
3 8 (3.85%) ISO/IEC 27001
4 7 (3.37%) MISRA
4 7 (3.37%) MISRA C
5 6 (2.88%) PMO
6 5 (2.40%) Data Quality
6 5 (2.40%) Government Security Classifications
7 4 (1.92%) NIST
8 3 (1.44%) ISO/IEC 27002 (supersedes ISO/IEC 17799)
8 3 (1.44%) QA
9 2 (0.96%) SLA
10 1 (0.48%) Actionable Recommendations
10 1 (0.48%) Cyber Essentials
10 1 (0.48%) GDPR
10 1 (0.48%) GRC
10 1 (0.48%) HIPAA
10 1 (0.48%) ISO 14001
10 1 (0.48%) JSP 440
10 1 (0.48%) PMBOK
System Software
1 16 (7.69%) Docker
2 12 (5.77%) VMware Infrastructure
3 8 (3.85%) Active Directory
4 2 (0.96%) Virtual Machines
5 1 (0.48%) Hyper-V
5 1 (0.48%) VMware ESXi
5 1 (0.48%) vSphere
Systems Management
1 17 (8.17%) Kubernetes
2 15 (7.21%) Ansible
3 12 (5.77%) Terraform
4 9 (4.33%) Grafana
5 8 (3.85%) Prometheus
6 6 (2.88%) MIIS
7 2 (0.96%) Kibana
7 2 (0.96%) logstash
8 1 (0.48%) Cisco Prime
8 1 (0.48%) Microsoft Clustering
8 1 (0.48%) Progress Chef
8 1 (0.48%) Puppet
8 1 (0.48%) SCCM
8 1 (0.48%) vCenter Server
Vendors
1 24 (11.54%) VMware
2 17 (8.17%) Microsoft
3 14 (6.73%) Cisco
4 12 (5.77%) Red Hat
5 10 (4.81%) Ericsson
5 10 (4.81%) Nokia
6 8 (3.85%) F5
6 8 (3.85%) Juniper
6 8 (3.85%) Palo Alto
7 6 (2.88%) Avaya
7 6 (2.88%) Oracle
7 6 (2.88%) Ribbon
7 6 (2.88%) SAP
8 5 (2.40%) Dell
8 5 (2.40%) HP
9 4 (1.92%) NetApp
10 3 (1.44%) Informatica
10 3 (1.44%) ServiceNow
11 2 (0.96%) Foundry
11 2 (0.96%) Palantir