Microsoft Hyper-V
London > Central London
The table below provides summary statistics and contractor rates for jobs advertised in Central London requiring Hyper-V skills. It covers contract job vacancies from the 6 months leading up to 23 February 2026, with comparisons to the same periods in the previous two years.
| 6 months to 23 Feb 2026 |
Same period 2025 | Same period 2024 | |
|---|---|---|---|
| Rank | 126 | 111 | 124 |
| Rank change year-on-year | -15 | +13 | +45 |
| Contract jobs citing Hyper-V | 2 | 11 | 9 |
| As % of all contract jobs in Central London | 0.094% | 0.53% | 0.35% |
| As % of the System Software category | 1.12% | 4.38% | 3.18% |
| Number of daily rates quoted | 2 | 7 | 9 |
| 10th Percentile | £378 | £435 | £263 |
| 25th Percentile | £383 | £478 | £400 |
| Median daily rate (50th Percentile) | £406 | £600 | £450 |
| Median % change year-on-year | -32.29% | +33.33% | -7.69% |
| 75th Percentile | £423 | - | £480 |
| 90th Percentile | £424 | - | £580 |
| London median daily rate | £525 | £400 | £500 |
| % change year-on-year | +31.25% | -20.00% | +2.56% |
All System Software Skills
Central London
Hyper-V falls under the System Software category. For comparison with the information above, the following table provides summary statistics for all contract job vacancies requiring system software skills in Central London.
| Contract vacancies with a requirement for system software skills | 179 | 251 | 283 |
| As % of all contract IT jobs advertised in Central London | 8.42% | 12.12% | 10.89% |
| Number of daily rates quoted | 131 | 163 | 210 |
| 10th Percentile | £263 | £245 | £219 |
| 25th Percentile | £413 | £410 | £350 |
| Median daily rate (50th Percentile) | £525 | £550 | £475 |
| Median % change year-on-year | -4.55% | +15.79% | -13.64% |
| 75th Percentile | £625 | £628 | £623 |
| 90th Percentile | £675 | £724 | £731 |
| London median daily rate | £525 | £565 | £500 |
| % change year-on-year | -7.08% | +13.00% | -13.04% |
| Number of hourly rates quoted | 5 | 4 | 5 |
| 10th Percentile | £22.68 | £48.48 | - |
| 25th Percentile | - | £89.31 | £21.25 |
| Median hourly rate | £25.47 | £112.00 | £40.00 |
| Median % change year-on-year | -77.26% | +180.00% | +88.24% |
| 75th Percentile | - | £130.88 | - |
| 90th Percentile | £46.02 | £164.85 | £46.15 |
| London median hourly rate | £25.31 | £29.00 | £25.00 |
| % change year-on-year | -12.72% | +16.00% | -18.70% |
Hyper-V
Job Vacancy Trend in Central London
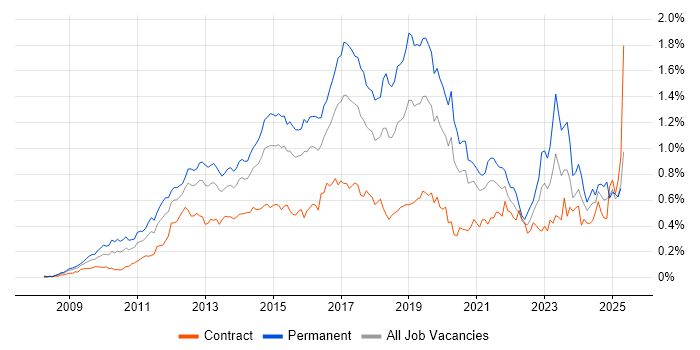
Historical trend showing the proportion of contract IT job postings citing Hyper-V relative to all contract IT jobs advertised in Central London.

Hyper-V
Daily Rate Trend in Central London
Contractor daily rate distribution trend for jobs in Central London citing Hyper-V.

Hyper-V
Hourly Rate Trend in Central London
Contractor hourly rate distribution trend for jobs in Central London citing Hyper-V.

Hyper-V
Contract Job Locations in Central London
The table below looks at the demand and provides a guide to the median contractor rates quoted in IT jobs citing Hyper-V within the Central London region over the 6 months to 23 February 2026. The 'Rank Change' column provides an indication of the change in demand within each location based on the same 6 month period last year.
| Location | Rank Change on Same Period Last Year |
Matching Contract IT Job Ads |
Median Daily Rate Past 6 Months |
Median Daily Rate % Change on Same Period Last Year |
Live Jobs |
|---|---|---|---|---|---|
| City of London | -8 | 2 | £406 | -18.75% | 10 |
| Hyper-V London |
|||||
Hyper-V
Co-Occurring Skills & Capabilities in Central London by Category
The following tables expand on the one above by listing co-occurrences grouped by category. They cover the same employment type, locality and period, with up to 20 co-occurrences shown in each category:
