Windows Contracts in Central London

Microsoft Windows
London > Central London

The following table provides summary statistics for contract job vacancies advertised in Central London with a requirement for Windows skills. Included is a benchmarking guide to the contractor rates offered in vacancies that have cited Windows over the 6 months to 27 April 2024 with a comparison to the same period in the previous 2 years.

6 months to
27 Apr 2024
Same period 2023 Same period 2022
Rank 16 14 19
Rank change year-on-year -2 +5 +14
Contract jobs citing Windows 214 365 368
As % of all contract jobs advertised in Central London 8.74% 9.47% 8.10%
As % of the Operating Systems category 67.51% 63.04% 60.93%
Number of daily rates quoted 155 259 296
10th Percentile £148 £140 £163
25th Percentile £250 £209 £245
Median daily rate (50th Percentile) £400 £400 £419
Median % change year-on-year - -4.48% -6.11%
75th Percentile £556 £560 £575
90th Percentile £675 £658 £659
London median daily rate £400 £500 £500
% change year-on-year -20.00% - +11.11%
Number of hourly rates quoted 5 1 14
10th Percentile £19.86 - -
25th Percentile £21.25 £15.75 £13.88
Median hourly rate £22.50 £16.50 £20.75
Median % change year-on-year +36.36% -20.48% +48.21%
75th Percentile £23.75 £17.25 £33.19
90th Percentile £25.70 - £70.13
London median hourly rate £22.00 £25.36 £23.91
% change year-on-year -13.23% +6.04% -1.81%

All Operating Systems
Central London

Windows is in the Operating Systems category. The following table is for comparison with the above and provides summary statistics for all contract job vacancies advertised in Central London with a requirement for operating system skills.

Contract vacancies with a requirement for operating system skills 317 579 604
As % of all contract IT jobs advertised in Central London 12.94% 15.02% 13.30%
Number of daily rates quoted 228 413 468
10th Percentile £184 £160 £184
25th Percentile £280 £250 £334
Median daily rate (50th Percentile) £450 £520 £500
Median % change year-on-year -13.46% +4.00% +2.56%
75th Percentile £638 £650 £608
90th Percentile £725 £725 £700
London median daily rate £500 £550 £550
% change year-on-year -9.09% - +10.00%
Number of hourly rates quoted 6 6 15
10th Percentile £18.93 £18.38 -
25th Percentile £19.51 £22.00 £13.88
Median hourly rate £22.50 £30.00 £24.50
Median % change year-on-year -25.00% +22.45% +75.00%
75th Percentile £23.75 £35.00 £31.38
90th Percentile £25.38 £59.38 £67.25
London median hourly rate £22.00 £37.34 £24.50
% change year-on-year -41.08% +52.41% -42.69%

Windows
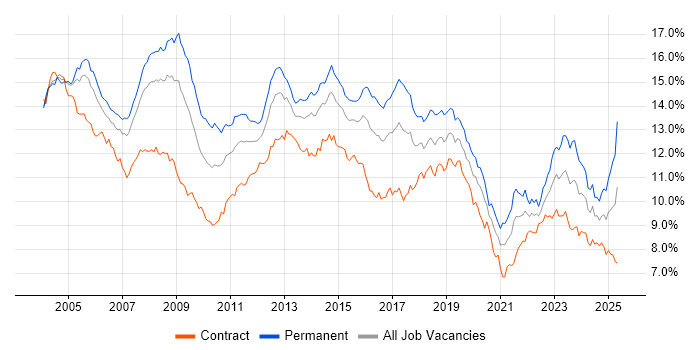
Job Vacancy Trend in Central London

Job postings citing Windows as a proportion of all IT jobs advertised in Central London.

Job vacancy trend for Windows in Central London

Windows
Contractor Daily Rate Trend in Central London

3-month moving average daily rate quoted in jobs citing Windows in Central London.

Daily rate trend for Windows in Central London

Windows
Daily Rate Histogram in Central London

Daily rate distribution for jobs citing Windows in Central London over the 6 months to 27 April 2024.

Daily rate histogram for Windows in Central London

Windows
Contractor Hourly Rate Trend in Central London

3-month moving average hourly rates quoted in jobs citing Windows in Central London.

Hourly rate trend for Windows in Central London

Windows
Contract Job Locations in Central London

The table below looks at the demand and provides a guide to the median contractor rates quoted in IT jobs citing Windows within the Central London region over the 6 months to 27 April 2024. The 'Rank Change' column provides an indication of the change in demand within each location based on the same 6 month period last year.

Location Rank Change
on Same Period
Last Year
Matching
Contract
IT Job Ads
Median
Daily Rate
Past 6 Months
Median Daily Rate
% Change
on Same Period
Last Year
Live
Jobs
City of London +2 190 £400 -11.11% 40
West End of London -9 4 £147 -60.67% 3
City of Westminster -10 2 £400 +8.11% 1
Camden 0 1 £600 - 1
Lambeth -3 1 £188 -1.32%
Kensington and Chelsea - 1 - -
Windows
London

Windows
Co-occurring Skills and Capabilities in Central London by Category

The follow tables expand on the table above by listing co-occurrences grouped by category. The same employment type, locality and period is covered with up to 20 co-occurrences shown in each of the following categories:

Application Platforms
1 44 (20.56%) Microsoft Exchange
2 15 (7.01%) SharePoint
3 11 (5.14%) IIS
4 7 (3.27%) BizTalk Server
5 6 (2.80%) Blackberry Enterprise Server
6 4 (1.87%) Apache
7 3 (1.40%) Exchange Server 2013
7 3 (1.40%) nginx
7 3 (1.40%) Tomcat
8 2 (0.93%) Exchange Server 2010
8 2 (0.93%) JBoss
8 2 (0.93%) WebSphere
9 1 (0.47%) Confluence
9 1 (0.47%) Oracle SOA Suite
9 1 (0.47%) Skype for Business
9 1 (0.47%) WordPress
Applications
1 24 (11.21%) Microsoft Office
2 7 (3.27%) Microsoft Excel
3 3 (1.40%) Adobe Premiere
4 2 (0.93%) Microsoft PowerPoint
Business Applications
1 2 (0.93%) Temenos T24
2 1 (0.47%) Advent Geneva
2 1 (0.47%) BusinessWorks
2 1 (0.47%) Front Arena
2 1 (0.47%) Loan IQ
2 1 (0.47%) Unit4 Business World
Cloud Services
1 74 (34.58%) Microsoft 365
2 70 (32.71%) Azure
3 24 (11.21%) AWS
3 24 (11.21%) Entra ID
4 12 (5.61%) Azure DevOps
5 11 (5.14%) Mimecast
6 9 (4.21%) Azure Storage
6 9 (4.21%) IaaS
6 9 (4.21%) OneDrive
6 9 (4.21%) PaaS
7 8 (3.74%) Power Platform
8 6 (2.80%) AWS Lambda
8 6 (2.80%) Azure Cosmos DB
8 6 (2.80%) Azure Functions
8 6 (2.80%) Azure Logic Apps
8 6 (2.80%) Serverless
9 5 (2.34%) GitHub
10 3 (1.40%) AWS CloudFormation
10 3 (1.40%) GCP
10 3 (1.40%) Google Workspace
Communications & Networking
1 40 (18.69%) Firewall
2 19 (8.88%) DNS
3 16 (7.48%) SAN
4 10 (4.67%) VPN
5 7 (3.27%) WAN
6 6 (2.80%) Internet
6 6 (2.80%) LAN
6 6 (2.80%) Network Security
7 5 (2.34%) DHCP
7 5 (2.34%) Wireless
8 4 (1.87%) Cisco IOS
8 4 (1.87%) FTP
8 4 (1.87%) MPLS
9 3 (1.40%) H.323
9 3 (1.40%) SSL
9 3 (1.40%) TCP/IP
10 2 (0.93%) NAS
10 2 (0.93%) Skype
11 1 (0.47%) Remote Desktop
11 1 (0.47%) WebEx
Database & Business Intelligence
1 26 (12.15%) SQL Server
2 9 (4.21%) MongoDB
3 7 (3.27%) Azure SQL Database
3 7 (3.27%) Relational Database
4 4 (1.87%) Hadoop
4 4 (1.87%) MySQL
4 4 (1.87%) RDBMS
5 3 (1.40%) Oracle Database
6 2 (0.93%) Amazon RDS
6 2 (0.93%) KDB
6 2 (0.93%) NoSQL
6 2 (0.93%) PostgreSQL
6 2 (0.93%) Power BI
7 1 (0.47%) Data Lake
7 1 (0.47%) Data Warehouse
7 1 (0.47%) DB2
7 1 (0.47%) Enterprise Data Warehouse
7 1 (0.47%) MariaDB
7 1 (0.47%) Metadata
7 1 (0.47%) SQL Server Integration Services
Development Applications
1 12 (5.61%) Git
2 10 (4.67%) Jenkins
2 10 (4.67%) JIRA
3 7 (3.27%) TeamCity
4 5 (2.34%) Bitbucket
4 5 (2.34%) GitLab
5 4 (1.87%) Hudson
6 2 (0.93%) Subversion
6 2 (0.93%) Visual Studio
7 1 (0.47%) AppScan
7 1 (0.47%) Artifactory
7 1 (0.47%) Burp Suite
7 1 (0.47%) Cucumber
7 1 (0.47%) IntelliJ
7 1 (0.47%) Maven
7 1 (0.47%) Octopus Deploy
7 1 (0.47%) Oracle APEX
7 1 (0.47%) Selenium
7 1 (0.47%) SonarQube
7 1 (0.47%) SQL Server Management Studio (SSMS)
General
1 59 (27.57%) Finance
2 56 (26.17%) Social Skills
3 35 (16.36%) Banking
4 13 (6.07%) Analytical Skills
5 9 (4.21%) Investment Banking
6 8 (3.74%) Front Office
6 8 (3.74%) Presentation Skills
6 8 (3.74%) Public Sector
7 6 (2.80%) Documentation Skills
8 5 (2.34%) Financial Institution
8 5 (2.34%) French Language
8 5 (2.34%) Law
9 4 (1.87%) Legal
10 3 (1.40%) Agriculture
10 3 (1.40%) Retail
10 3 (1.40%) Telecoms
11 2 (0.93%) Advertising
11 2 (0.93%) Italian Language
11 2 (0.93%) Japanese Language
11 2 (0.93%) Organisational Skills
Job Titles
1 41 (19.16%) Support Engineer
2 35 (16.36%) Analyst
3 23 (10.75%) Desktop Support
4 22 (10.28%) IT Support
5 17 (7.94%) Desktop Engineer
6 15 (7.01%) IT Engineer
7 13 (6.07%) Desktop Support Engineer
7 13 (6.07%) IT Analyst
8 12 (5.61%) Developer
8 12 (5.61%) Infrastructure Engineer
9 10 (4.67%) IT Support Engineer
10 9 (4.21%) Architect
11 8 (3.74%) Azure Engineer
11 8 (3.74%) Lead
11 8 (3.74%) Support Analyst
11 8 (3.74%) Windows Engineer
12 7 (3.27%) 2nd Line Support
13 6 (2.80%) Applications Support
13 6 (2.80%) Software Engineer
13 6 (2.80%) Systems Analyst
Libraries, Frameworks & Software Standards
1 17 (7.94%) .NET
2 8 (3.74%) .NET Core
3 7 (3.27%) ASP.NET
4 6 (2.80%) .NET Framework
4 6 (2.80%) Blazor
4 6 (2.80%) Web Services
5 4 (1.87%) LDAP
6 3 (1.40%) ARM Templates
7 2 (0.93%) Elastic Stack
7 2 (0.93%) IBM Integration Bus
7 2 (0.93%) JSON
7 2 (0.93%) Middleware
7 2 (0.93%) XML
8 1 (0.47%) FIX Protocol
8 1 (0.47%) HTML5
8 1 (0.47%) OAuth
8 1 (0.47%) RabbitMQ
8 1 (0.47%) TIBCO EMS
8 1 (0.47%) WebSphere MQ
8 1 (0.47%) YAML
Miscellaneous
1 21 (9.81%) Video Conferencing
2 14 (6.54%) Blackberry
3 11 (5.14%) Data Centre
4 10 (4.67%) Management Information System
5 6 (2.80%) Cloud Native
5 6 (2.80%) Legacy Systems
5 6 (2.80%) Replication
6 5 (2.34%) Public Cloud
7 4 (1.87%) Hedge funds
7 4 (1.87%) iPhone
8 3 (1.40%) Cyber Threat
8 3 (1.40%) Enterprise Software
8 3 (1.40%) Self-Motivation
9 2 (0.93%) Distributed Systems
9 2 (0.93%) Foreign Exchange (FX)
9 2 (0.93%) IoT
9 2 (0.93%) iPad
9 2 (0.93%) Linux Command Line
9 2 (0.93%) Product Ownership
10 1 (0.47%) EPoS
Operating Systems
1 43 (20.09%) Windows Server
2 42 (19.63%) Windows 10
3 39 (18.22%) Linux
4 19 (8.88%) Windows Server 2012
5 18 (8.41%) Windows Server 2016
6 15 (7.01%) Android
6 15 (7.01%) Unix
7 13 (6.07%) Mac OS
8 12 (5.61%) Windows 7
9 9 (4.21%) Mac OS X
10 7 (3.27%) Apple iOS
11 6 (2.80%) Windows 8
11 6 (2.80%) Windows Server 2019
12 3 (1.40%) Red Hat Enterprise Linux
12 3 (1.40%) VMS
12 3 (1.40%) Windows Server 2008
13 1 (0.47%) CentOS
13 1 (0.47%) OpenVMS
13 1 (0.47%) Ubuntu
Processes & Methodologies
1 28 (13.08%) Customer Service
2 27 (12.62%) DevOps
3 26 (12.15%) Infrastructure Engineering
4 24 (11.21%) Migration
5 22 (10.28%) Disaster Recovery
6 21 (9.81%) Problem-Solving
7 19 (8.88%) Agile
7 19 (8.88%) ITIL
8 16 (7.48%) Asset Management
8 16 (7.48%) CI/CD
9 15 (7.01%) SDLC
9 15 (7.01%) Software Engineering
10 14 (6.54%) Business Continuity
11 12 (5.61%) Information Security
12 10 (4.67%) Analytics
13 9 (4.21%) IT Strategy
13 9 (4.21%) Software Deployment
14 8 (3.74%) Computer Science
14 8 (3.74%) Infrastructure as Code
14 8 (3.74%) Microservices
Programming Languages
1 47 (21.96%) PowerShell
2 35 (16.36%) Python
3 31 (14.49%) SQL
4 13 (6.07%) C#
5 12 (5.61%) C++
6 10 (4.67%) T-SQL
7 8 (3.74%) PL/SQL
8 7 (3.27%) JavaScript
9 6 (2.80%) Bash
9 6 (2.80%) Go
10 5 (2.34%) Java
10 5 (2.34%) Shell Script
11 3 (1.40%) VBScript
12 1 (0.47%) Perl
12 1 (0.47%) PHP
12 1 (0.47%) VB
12 1 (0.47%) VC++
12 1 (0.47%) XPath
Qualifications
1 16 (7.48%) Degree
2 12 (5.61%) Security Cleared
3 10 (4.67%) Azure Certification
4 7 (3.27%) SC Cleared
5 4 (1.87%) DV Cleared
5 4 (1.87%) ISTQB
5 4 (1.87%) TOGAF Certification
6 3 (1.40%) ISEB
6 3 (1.40%) Microsoft Certification
7 2 (0.93%) A+ Certification
7 2 (0.93%) CCNA
7 2 (0.93%) Cisco Certification
7 2 (0.93%) Computer Science Degree
7 2 (0.93%) GCIA
7 2 (0.93%) GCIH
7 2 (0.93%) GIAC
7 2 (0.93%) ITIL Certification
7 2 (0.93%) ITIL Foundation Certificate
7 2 (0.93%) MCSE
8 1 (0.47%) SANS
Quality Assurance & Compliance
1 13 (6.07%) QA
2 6 (2.80%) SLA
3 2 (0.93%) ISO/IEC 27001
4 1 (0.47%) COBIT
4 1 (0.47%) Data Quality
4 1 (0.47%) HIPAA
4 1 (0.47%) ISO/IEC 27002 (supersedes ISO/IEC 17799)
4 1 (0.47%) MiFID
4 1 (0.47%) NIST
4 1 (0.47%) PCI DSS
4 1 (0.47%) PMO
System Software
1 87 (40.65%) Active Directory
2 15 (7.01%) VMware Infrastructure
3 8 (3.74%) Hyper-V
4 7 (3.27%) Virtual Machines
5 4 (1.87%) HDFS
5 4 (1.87%) NFS
5 4 (1.87%) Virtual Desktop
6 3 (1.40%) Docker
7 1 (0.47%) iptables
7 1 (0.47%) KVM
7 1 (0.47%) Oracle RAC
7 1 (0.47%) vSphere
Systems Management
1 38 (17.76%) SCCM
2 25 (11.68%) Microsoft Intune
3 11 (5.14%) Kubernetes
4 8 (3.74%) Ansible
4 8 (3.74%) Terraform
5 7 (3.27%) Jamf Pro
6 4 (1.87%) Puppet
7 3 (1.40%) Active Directory Federation Services
7 3 (1.40%) Nessus
8 2 (0.93%) CSIRT
8 2 (0.93%) Grafana
8 2 (0.93%) Graylog
8 2 (0.93%) Nagios
8 2 (0.93%) Packer
8 2 (0.93%) Progress Chef
8 2 (0.93%) Prometheus
8 2 (0.93%) QRadar
8 2 (0.93%) Single Sign-On
9 1 (0.47%) HP Fortify
9 1 (0.47%) Kibana
Vendors
1 71 (33.18%) Microsoft
2 38 (17.76%) Citrix
3 25 (11.68%) Oracle
4 22 (10.28%) Cisco
4 22 (10.28%) VMware
5 17 (7.94%) HP
6 15 (7.01%) Apple
6 15 (7.01%) Avaya
7 13 (6.07%) CheckPoint
7 13 (6.07%) EMC
8 11 (5.14%) ServiceNow
9 10 (4.67%) Adobe
9 10 (4.67%) Bloomberg
10 8 (3.74%) IBM
11 6 (2.80%) Ivanti
11 6 (2.80%) MuleSoft
11 6 (2.80%) Red Hat
11 6 (2.80%) Reuters
12 5 (2.34%) Dell
12 5 (2.34%) Okta