R
London > Central London
The table below provides summary statistics and contractor rates for jobs advertised in Central London requiring R skills. It covers contract job vacancies from the 6 months leading up to 3 October 2025, with comparisons to the same periods in the previous two years.
| 6 months to 3 Oct 2025 |
Same period 2024 | Same period 2023 | |
|---|---|---|---|
| Rank | 110 | 115 | 137 |
| Rank change year-on-year | +5 | +22 | +34 |
| Contract jobs citing R | 16 | 13 | 19 |
| As % of all contract jobs in Central London | 0.83% | 0.56% | 0.61% |
| As % of the Programming Languages category | 2.28% | 1.63% | 1.66% |
| Number of daily rates quoted | 10 | 11 | 17 |
| 10th Percentile | £293 | £225 | £350 |
| 25th Percentile | £494 | £419 | £375 |
| Median daily rate (50th Percentile) | £550 | £475 | £513 |
| Median % change year-on-year | +15.79% | -7.32% | -12.77% |
| 75th Percentile | - | £569 | £669 |
| 90th Percentile | - | £675 | £793 |
| London median daily rate | £500 | £475 | £519 |
| % change year-on-year | +5.26% | -8.43% | -20.19% |
| Number of hourly rates quoted | 2 | 0 | 0 |
| 10th Percentile | £29.75 | - | - |
| 25th Percentile | £35.00 | - | - |
| Median hourly rate | £45.00 | - | - |
| 75th Percentile | £55.00 | - | - |
| 90th Percentile | £60.25 | - | - |
| London median hourly rate | £37.50 | £52.50 | £35.32 |
| % change year-on-year | -28.57% | +48.66% | -0.52% |
All Programming Languages
Central London
R falls under the Programming Languages category. For comparison with the information above, the following table provides summary statistics for all contract job vacancies requiring coding skills in Central London.
| Contract vacancies with a requirement for coding skills | 703 | 799 | 1,146 |
| As % of all contract IT jobs advertised in Central London | 36.44% | 34.15% | 36.51% |
| Number of daily rates quoted | 500 | 536 | 787 |
| 10th Percentile | £374 | £406 | £400 |
| 25th Percentile | £437 | £481 | £495 |
| Median daily rate (50th Percentile) | £575 | £575 | £605 |
| Median % change year-on-year | - | -5.03% | +3.06% |
| 75th Percentile | £688 | £708 | £725 |
| 90th Percentile | £775 | £825 | £831 |
| London median daily rate | £550 | £575 | £600 |
| % change year-on-year | -4.35% | -4.17% | - |
| Number of hourly rates quoted | 8 | 5 | 1 |
| 10th Percentile | £22.98 | £38.35 | - |
| 25th Percentile | £26.13 | £40.75 | £12.25 |
| Median hourly rate | £42.72 | £41.50 | £12.50 |
| Median % change year-on-year | +2.94% | +232.00% | -76.19% |
| 75th Percentile | £63.75 | £112.00 | £12.75 |
| 90th Percentile | £71.25 | - | - |
| London median hourly rate | £44.20 | £48.50 | £60.00 |
| % change year-on-year | -8.87% | -19.17% | +10.60% |
R
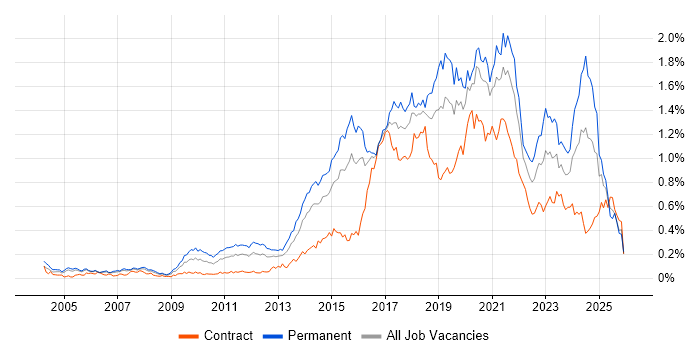
Job Vacancy Trend in Central London
Historical trend showing the proportion of contract IT job postings citing R relative to all contract IT jobs advertised in Central London.

R
Daily Rate Trend in Central London
Contractor daily rate distribution trend for jobs in Central London citing R.

R
Daily Rate Histogram in Central London
Daily rate distribution for jobs citing R in Central London over the 6 months to 3 October 2025.
R
Hourly Rate Trend in Central London
Contractor hourly rate distribution trend for jobs in Central London citing R.

R
Hourly Rate Histogram in Central London
Hourly rate distribution of jobs citing R in Central London over the 6 months to 3 October 2025.
R
Contract Job Locations in Central London
The table below looks at the demand and provides a guide to the median contractor rates quoted in IT jobs citing R within the Central London region over the 6 months to 3 October 2025. The 'Rank Change' column provides an indication of the change in demand within each location based on the same 6 month period last year.
| Location | Rank Change on Same Period Last Year |
Matching Contract IT Job Ads |
Median Daily Rate Past 6 Months |
Median Daily Rate % Change on Same Period Last Year |
Live Jobs |
|---|---|---|---|---|---|
| City of London | +8 | 14 | £550 | +15.79% | 7 |
| R London |
|||||
R
Co-Occurring Skills & Capabilities in Central London by Category
The following tables expand on the one above by listing co-occurrences grouped by category. They cover the same employment type, locality and period, with up to 20 co-occurrences shown in each category:
