Marketing Contract Job Trends in Central London

Marketing
London > Central London

The table below looks at the prevalence of the term Marketing in contract job vacancies in Central London. Included is a benchmarking guide to the contractor rates offered in vacancies that cited Marketing over the 6 months leading up to 24 November 2025, comparing them to the same period in the previous two years.

6 months to
24 Nov 2025
Same period 2024 Same period 2023
Rank 77 75 69
Rank change year-on-year -2 -6 +51
Contract jobs citing Marketing 54 63 82
As % of all contract jobs in Central London 2.76% 2.64% 2.83%
As % of the General category 3.77% 3.96% 4.35%
Number of daily rates quoted 39 35 51
10th Percentile £240 £279 £184
25th Percentile £377 £363 £297
Median daily rate (50th Percentile) £475 £550 £590
Median % change year-on-year -13.64% -6.78% +0.43%
75th Percentile £622 £625 £698
90th Percentile £753 £683 £850
London median daily rate £450 £450 £516
% change year-on-year - -12.83% -1.67%
Number of hourly rates quoted 2 1 4
10th Percentile £22.88 - -
25th Percentile £27.52 £146.25 £17.00
Median hourly rate £35.82 £147.50 £19.00
Median % change year-on-year -75.72% +676.32% -56.06%
75th Percentile £44.27 £148.75 £22.94
90th Percentile £49.00 - £26.43
London median hourly rate £36.75 £45.25 £30.00
% change year-on-year -18.78% +50.83% -20.00%

All General Skills
Central London

Marketing falls under the General Skills category. For comparison with the information above, the following table provides summary statistics for all contract job vacancies requiring common skills in Central London.

Contract vacancies with a requirement for common skills 1,432 1,590 1,884
As % of all contract IT jobs advertised in Central London 73.14% 66.67% 64.99%
Number of daily rates quoted 984 981 1,351
10th Percentile £322 £350 £350
25th Percentile £413 £463 £463
Median daily rate (50th Percentile) £550 £585 £585
Median % change year-on-year -5.98% - +1.74%
75th Percentile £675 £688 £695
90th Percentile £772 £797 £825
London median daily rate £537 £575 £575
% change year-on-year -6.61% - -4.17%
Number of hourly rates quoted 25 12 15
10th Percentile £17.65 £14.80 £17.00
25th Percentile £20.18 £25.75 £17.50
Median hourly rate £28.50 £35.00 £27.50
Median % change year-on-year -18.57% +27.27% -36.05%
75th Percentile £41.94 £65.63 £65.00
90th Percentile £63.75 £91.13 £71.75
London median hourly rate £26.40 £38.54 £35.25
% change year-on-year -31.49% +9.32% +6.02%

Marketing
Job Vacancy Trend in Central London

Historical trend showing the proportion of contract IT job postings citing Marketing relative to all contract IT jobs advertised in Central London.
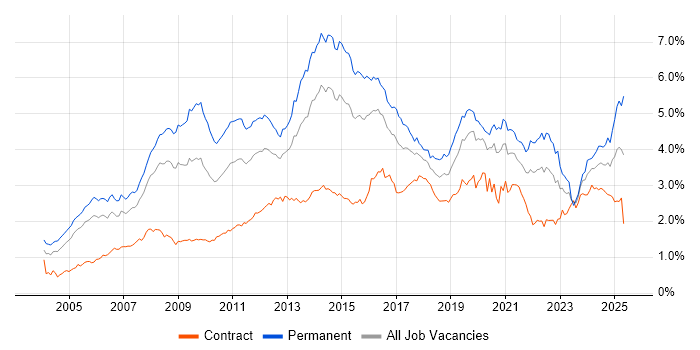
Marketing job vacancy trend in Central London

Marketing
Daily Rate Trend in Central London

Contractor daily rate distribution trend for jobs in Central London citing Marketing.

Contractor daily rate distribution trend for jobs in Central London citing Marketing

Marketing
Daily Rate Histogram in Central London

Daily rate distribution for jobs citing Marketing in Central London over the 6 months to 24 November 2025.

Daily rate histogram for Marketing in Central London

Marketing
Hourly Rate Trend in Central London

Contractor hourly rate distribution trend for jobs in Central London citing Marketing.

Contractor hourly rate distribution trend for jobs in Central London citing Marketing

Marketing
Hourly Rate Histogram in Central London

Hourly rate distribution of jobs citing Marketing in Central London over the 6 months to 24 November 2025.

Hourly rate histogram for Marketing in Central London

Marketing
Contract Job Locations in Central London

The table below looks at the demand and provides a guide to the median contractor rates quoted in IT jobs citing Marketing within the Central London region over the 6 months to 24 November 2025. The 'Rank Change' column provides an indication of the change in demand within each location based on the same 6 month period last year.

Location Rank Change
on Same Period
Last Year
Matching
Contract
IT Job Ads
Median
Daily Rate
Past 6 Months
Median Daily Rate
% Change
on Same Period
Last Year
Live
Jobs
City of London -10 48 £475 -17.39% 66
West End of London +13 5 £475 - 1
Southwark +1 1 £725 +93.33% 1
Camden - 1 £400 -
Marketing
London

Marketing
Co-Occurring Skills & Capabilities in Central London by Category

The following tables expand on the one above by listing co-occurrences grouped by category. They cover the same employment type, locality and period, with up to 20 co-occurrences shown in each category:

Application Platforms
1 2 (3.70%) CMS
1 2 (3.70%) SharePoint
2 1 (1.85%) Apache Spark
2 1 (1.85%) WordPress
Applications
1 1 (1.85%) Microsoft Excel
Business Applications
1 6 (11.11%) Dynamics CRM
2 2 (3.70%) Workfront
3 1 (1.85%) NetSuite
3 1 (1.85%) Salesforce CRM
3 1 (1.85%) Sprinklr
Cloud Services
1 10 (18.52%) SaaS
2 5 (9.26%) Azure
2 5 (9.26%) Power Platform
3 4 (7.41%) PowerApps
4 3 (5.56%) Boomi
4 3 (5.56%) Dynamics 365
4 3 (5.56%) GCP
4 3 (5.56%) Power Automate
4 3 (5.56%) Salesforce Sales Cloud
5 2 (3.70%) AWS
5 2 (3.70%) Azure DevOps
5 2 (3.70%) Google Ads
5 2 (3.70%) Google Analytics
5 2 (3.70%) IaaS
5 2 (3.70%) iPaaS
5 2 (3.70%) Salesforce Service Cloud
6 1 (1.85%) Azure Data Factory
6 1 (1.85%) Azure Functions
6 1 (1.85%) Google App Engine
6 1 (1.85%) Serverless
Communications & Networking
1 1 (1.85%) SMS
Database & Business Intelligence
1 3 (5.56%) Mixpanel
2 2 (3.70%) Power BI
3 1 (1.85%) Tableau
Development Applications
1 3 (5.56%) Visual Website Optimizer
General
1 29 (53.70%) Social Skills
2 13 (24.07%) Analytical Skills
3 11 (20.37%) Finance
4 7 (12.96%) Legal
5 6 (11.11%) Retail
6 4 (7.41%) Telecoms
7 3 (5.56%) Manufacturing
7 3 (5.56%) Presentation Skills
7 3 (5.56%) Public Sector
8 2 (3.70%) Advertising
8 2 (3.70%) Banking
8 2 (3.70%) Electronics
8 2 (3.70%) Inclusion and Diversity
9 1 (1.85%) Brand Awareness
9 1 (1.85%) French Language
9 1 (1.85%) German Language
9 1 (1.85%) Investment Banking
9 1 (1.85%) Organisational Skills
9 1 (1.85%) Portuguese Language
Job Titles
1 7 (12.96%) Lead
2 5 (9.26%) Marketing Manager
3 4 (7.41%) Analyst
3 4 (7.41%) Architect
3 4 (7.41%) Project Manager
3 4 (7.41%) Senior
4 3 (5.56%) Conversion Specialist
4 3 (5.56%) Procurement Manager
4 3 (5.56%) Senior Manager
5 2 (3.70%) Business Analyst
5 2 (3.70%) Change Manager
5 2 (3.70%) Data Analyst
5 2 (3.70%) Developer
5 2 (3.70%) Marketing Assistant
5 2 (3.70%) Salesforce Architect
5 2 (3.70%) Senior Marketing Manager
5 2 (3.70%) Solutions Architect
6 1 (1.85%) Content Manager
6 1 (1.85%) CRM Developer
6 1 (1.85%) Customer Insight Manager
Libraries, Frameworks & Software Standards
1 3 (5.56%) CSS
1 3 (5.56%) HTML
2 1 (1.85%) .NET
2 1 (1.85%) AngularJS
2 1 (1.85%) ASP.NET Web API
2 1 (1.85%) Lightning Web Components
2 1 (1.85%) Middleware
2 1 (1.85%) Pandas
Miscellaneous
1 10 (18.52%) Onboarding
2 5 (9.26%) Marketing Technology
3 4 (7.41%) Social Media
4 3 (5.56%) Analytical Mindset
5 2 (3.70%) Data Centre
5 2 (3.70%) Data Structures
5 2 (3.70%) Greenfield Project
5 2 (3.70%) Web Conferencing
6 1 (1.85%) Blog
6 1 (1.85%) Digital Media
6 1 (1.85%) Enterprise Software
6 1 (1.85%) Media Streaming
6 1 (1.85%) Multi-touch
6 1 (1.85%) Product Ownership
Operating Systems
1 2 (3.70%) Windows
Processes & Methodologies
1 17 (31.48%) Stakeholder Management
2 13 (24.07%) Analytics
2 13 (24.07%) CRM
3 10 (18.52%) Stakeholder Engagement
4 9 (16.67%) Digital Marketing
5 7 (12.96%) Actionable Insight
5 7 (12.96%) Problem-Solving
6 6 (11.11%) Agile
6 6 (11.11%) Business Intelligence
6 6 (11.11%) Customer Experience
6 6 (11.11%) E-Commerce
6 6 (11.11%) Roadmaps
6 6 (11.11%) Storytelling
6 6 (11.11%) User Experience
7 5 (9.26%) Business Strategy
7 5 (9.26%) Campaign Management
7 5 (9.26%) Customer Engagement
7 5 (9.26%) Dashboard Development
7 5 (9.26%) Marketing Strategy
7 5 (9.26%) Project Management
Programming Languages
1 7 (12.96%) SQL
2 5 (9.26%) JavaScript
3 3 (5.56%) Python
4 2 (3.70%) C#
5 1 (1.85%) Apex Code
5 1 (1.85%) R
Qualifications
1 10 (18.52%) Degree
2 3 (5.56%) PMI Certification
2 3 (5.56%) PMP
3 2 (3.70%) APMG
3 2 (3.70%) Master's Degree
3 2 (3.70%) Microsoft Certification
4 1 (1.85%) Computer Science Degree
4 1 (1.85%) PhD
4 1 (1.85%) TOGAF Certification
Quality Assurance & Compliance
1 3 (5.56%) GDPR
2 2 (3.70%) SLA
3 1 (1.85%) Accessibility
3 1 (1.85%) Data Quality
3 1 (1.85%) PMO
3 1 (1.85%) QA
Vendors
1 16 (29.63%) Salesforce
2 10 (18.52%) Google
3 6 (11.11%) Microsoft
3 6 (11.11%) SAP
4 5 (9.26%) Adobe
5 4 (7.41%) Salesforce Marketing Cloud
6 3 (5.56%) Amplitude
6 3 (5.56%) Hotjar
6 3 (5.56%) Optimizely
7 2 (3.70%) Marketo
7 2 (3.70%) Oracle
8 1 (1.85%) Ariba
8 1 (1.85%) Dell
8 1 (1.85%) Informatica
8 1 (1.85%) Instagram
8 1 (1.85%) MuleSoft
8 1 (1.85%) TikTok
8 1 (1.85%) Workday
8 1 (1.85%) Xactly
8 1 (1.85%) YouTube