Linux Contracts in Central London

Linux
London > Central London

The table below provides summary statistics for contract job vacancies advertised in Central London requiring Linux skills. It includes a benchmarking guide to the contractor rates offered in vacancies that cited Linux over the 6 months leading up to 1 May 2025, comparing them to the same period in the previous two years.

6 months to
1 May 2025
Same period 2024 Same period 2023
Rank 36 46 29
Rank change year-on-year +10 -17 +15
Contract jobs citing Linux 112 106 225
As % of all contract jobs advertised in Central London 5.61% 4.33% 5.84%
As % of the Operating Systems category 40.00% 33.97% 38.99%
Number of daily rates quoted 80 70 162
10th Percentile £412 £376 £425
25th Percentile £510 £420 £520
Median daily rate (50th Percentile) £640 £575 £641
Median % change year-on-year +11.35% -10.33% +11.52%
75th Percentile £696 £695 £700
90th Percentile £750 £750 £758
London median daily rate £588 £565 £625
% change year-on-year +3.98% -9.60% +2.04%
Number of hourly rates quoted 0 0 1
10th Percentile - - -
25th Percentile - - £81.25
Median hourly rate - - £82.50
75th Percentile - - £83.75
90th Percentile - - -
London median hourly rate £44.50 £62.50 £75.00
% change year-on-year -28.80% -16.67% +42.86%

All Operating Systems
Central London

Linux falls under the Operating Systems category. For comparison with the information above, the following table provides summary statistics for all contract job vacancies requiring operating system skills in Central London.

Contract vacancies with a requirement for operating system skills 280 312 577
As % of all contract IT jobs advertised in Central London 14.02% 12.76% 14.97%
Number of daily rates quoted 202 224 412
10th Percentile £243 £182 £160
25th Percentile £350 £280 £250
Median daily rate (50th Percentile) £513 £450 £523
Median % change year-on-year +13.89% -13.88% +4.50%
75th Percentile £639 £642 £650
90th Percentile £710 £725 £730
London median daily rate £500 £500 £550
% change year-on-year - -9.09% -
Number of hourly rates quoted 2 5 5
10th Percentile £35.38 £19.86 £22.60
25th Percentile £56.56 £21.25 £25.00
Median hourly rate £98.75 £22.50 £35.00
Median % change year-on-year +338.89% -35.71% +42.86%
75th Percentile £146.56 £23.75 -
90th Percentile £171.13 £25.70 £64.25
London median hourly rate £24.66 £22.00 £37.34
% change year-on-year +12.09% -41.08% +52.41%

Linux
Job Vacancy Trend in Central London

Job postings citing Linux as a proportion of all IT jobs advertised in Central London.
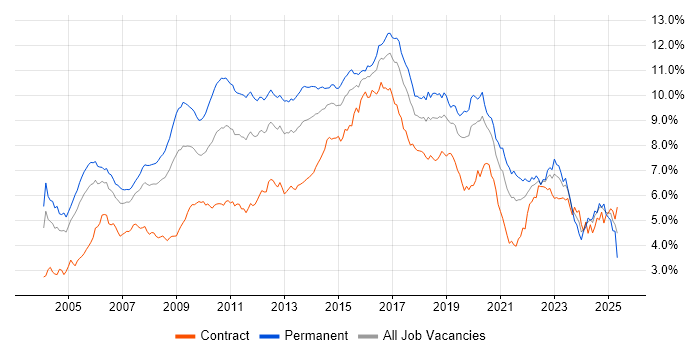
Job vacancy trend for Linux in Central London

Linux
Contractor Daily Rate Trend in Central London

3-month moving average daily rate quoted in jobs citing Linux in Central London.

Daily rate trend for Linux in Central London

Linux
Daily Rate Histogram in Central London

Daily rate distribution for jobs citing Linux in Central London over the 6 months to 1 May 2025.

Daily rate histogram for Linux in Central London

Linux
Contractor Hourly Rate Trend in Central London

3-month moving average hourly rates quoted in jobs citing Linux in Central London.

Hourly rate trend for Linux in Central London

Linux
Contract Job Locations in Central London

The table below looks at the demand and provides a guide to the median contractor rates quoted in IT jobs citing Linux within the Central London region over the 6 months to 1 May 2025. The 'Rank Change' column provides an indication of the change in demand within each location based on the same 6 month period last year.

Location Rank Change
on Same Period
Last Year
Matching
Contract
IT Job Ads
Median
Daily Rate
Past 6 Months
Median Daily Rate
% Change
on Same Period
Last Year
Live
Jobs
City of London +9 104 £645 +9.83% 63
City of Westminster - 2 £638 -
West End of London - 1 £580 - 6
Camden - 1 £580 -
Linux
London

Linux
Co-occurring Skills and Capabilities in Central London by Category

The follow tables expand on the table above by listing co-occurrences grouped by category. The same employment type, locality and period is covered with up to 20 co-occurrences shown in each of the following categories:

Application Platforms
1 7 (6.25%) Apache
1 7 (6.25%) Apache Spark
2 6 (5.36%) Confluence
3 4 (3.57%) Jupyter
3 4 (3.57%) OpenStack
4 3 (2.68%) SAS
4 3 (2.68%) SharePoint
5 2 (1.79%) Apache Airflow
5 2 (1.79%) CMS
5 2 (1.79%) IIS
6 1 (0.89%) Adobe Experience Manager
6 1 (0.89%) Documentum
6 1 (0.89%) Microsoft Exchange
6 1 (0.89%) nginx
Applications
1 3 (2.68%) Microsoft Office
2 2 (1.79%) Microsoft Project
3 1 (0.89%) Microsoft Excel
3 1 (0.89%) Microsoft PowerPoint
3 1 (0.89%) MS Visio
Business Applications
1 2 (1.79%) Actimize
1 2 (1.79%) Sage X3
2 1 (0.89%) Oracle BPM
Cloud Services
1 25 (22.32%) AWS
2 22 (19.64%) Azure
3 13 (11.61%) GCP
4 8 (7.14%) GitHub
5 6 (5.36%) Cloud Computing
6 5 (4.46%) Power Platform
7 4 (3.57%) AWS CloudFormation
7 4 (3.57%) Azure AKS
7 4 (3.57%) Microsoft 365
7 4 (3.57%) SaaS
7 4 (3.57%) Serverless
8 3 (2.68%) Amazon EKS
8 3 (2.68%) Amazon S3
8 3 (2.68%) Entra ID
8 3 (2.68%) IaaS
8 3 (2.68%) OCI
8 3 (2.68%) PaaS
8 3 (2.68%) Slack
8 3 (2.68%) Virtual Private Cloud
9 2 (1.79%) AWS Lambda
Communications & Networking
1 9 (8.04%) DNS
2 8 (7.14%) Firewall
3 7 (6.25%) VPN
4 5 (4.46%) DHCP
4 5 (4.46%) TCP/IP
5 4 (3.57%) SSH
6 3 (2.68%) HTTP
7 2 (1.79%) Kerberos
7 2 (1.79%) Multicast
7 2 (1.79%) Network Security
8 1 (0.89%) 5G
8 1 (0.89%) Cisco ISE
8 1 (0.89%) Intrusion Detection
8 1 (0.89%) LAN
8 1 (0.89%) NetScaler
8 1 (0.89%) Radio Access Network
8 1 (0.89%) VLAN
8 1 (0.89%) WAN
8 1 (0.89%) Wi-Fi
8 1 (0.89%) Wireless
Database & Business Intelligence
1 15 (13.39%) SQL Server
2 8 (7.14%) NoSQL
3 7 (6.25%) Relational Database
4 6 (5.36%) Azure SQL Database
4 6 (5.36%) MongoDB
4 6 (5.36%) MySQL
5 5 (4.46%) Data Warehouse
5 5 (4.46%) Power BI
6 4 (3.57%) Amazon RDS
6 4 (3.57%) Apache Hive
6 4 (3.57%) Delta Lake
6 4 (3.57%) PostgreSQL
7 3 (2.68%) Base SAS
7 3 (2.68%) Big Data
7 3 (2.68%) DB2
7 3 (2.68%) DynamoDB
7 3 (2.68%) Hadoop
7 3 (2.68%) KDB
7 3 (2.68%) Metadata
8 2 (1.79%) Apache Cassandra
Development Applications
1 27 (24.11%) Git
2 13 (11.61%) JIRA
3 12 (10.71%) Jenkins
4 7 (6.25%) GitLab
5 5 (4.46%) JUnit
6 4 (3.57%) RStudio
7 3 (2.68%) Bitbucket
7 3 (2.68%) Bitbucket Server
7 3 (2.68%) Subversion
7 3 (2.68%) TeamCity
8 2 (1.79%) Atlassian Bamboo
8 2 (1.79%) Cucumber
8 2 (1.79%) JMeter
8 2 (1.79%) SonarQube
9 1 (0.89%) Artifactory
9 1 (0.89%) Cypress.io
9 1 (0.89%) Gatling
9 1 (0.89%) Hamcrest
9 1 (0.89%) Jasmine
9 1 (0.89%) LoadRunner
General
1 42 (37.50%) Finance
2 29 (25.89%) Social Skills
3 12 (10.71%) Banking
4 10 (8.93%) Analytical Skills
5 7 (6.25%) Front Office
6 5 (4.46%) Financial Institution
6 5 (4.46%) Public Sector
7 3 (2.68%) Documentation Skills
7 3 (2.68%) Investment Banking
8 2 (1.79%) General Ledger
8 2 (1.79%) Military
8 2 (1.79%) Organisational Skills
9 1 (0.89%) Advertising
9 1 (0.89%) Electronics
9 1 (0.89%) French Language
9 1 (0.89%) Games
9 1 (0.89%) International Banking
9 1 (0.89%) Retail
9 1 (0.89%) Retail Banking
9 1 (0.89%) Telecoms
Job Titles
1 18 (16.07%) Developer
2 11 (9.82%) Lead
3 9 (8.04%) DevOps Engineer
3 9 (8.04%) Java Developer
3 9 (8.04%) Senior
4 6 (5.36%) Architect
4 6 (5.36%) Consultant
5 5 (4.46%) Data Engineer
5 5 (4.46%) Team Leader
6 4 (3.57%) Analyst
6 4 (3.57%) Cloud Engineer
6 4 (3.57%) Python Developer
6 4 (3.57%) Software Engineer
7 3 (2.68%) C# Developer
7 3 (2.68%) Infrastructure Manager
7 3 (2.68%) Infrastructure Project Manager
7 3 (2.68%) Linux Engineer
7 3 (2.68%) Project Manager
7 3 (2.68%) Senior Developer
7 3 (2.68%) Support Engineer
Libraries, Frameworks & Software Standards
1 7 (6.25%) Spring
2 5 (4.46%) AngularJS
2 5 (4.46%) Kafka
2 5 (4.46%) RESTful
2 5 (4.46%) Web Services
2 5 (4.46%) YAML
3 4 (3.57%) Elastic Stack
3 4 (3.57%) FIX Protocol
3 4 (3.57%) HTML
3 4 (3.57%) JSON
3 4 (3.57%) pydantic
3 4 (3.57%) PySpark
3 4 (3.57%) React
3 4 (3.57%) WPF
4 3 (2.68%) Node.js
4 3 (2.68%) Spring Boot
5 2 (1.79%) .NET
5 2 (1.79%) HTML5
5 2 (1.79%) RabbitMQ
5 2 (1.79%) WebSockets
Miscellaneous
1 10 (8.93%) Social Media
2 7 (6.25%) Distributed Systems
2 7 (6.25%) Foreign Exchange (FX)
2 7 (6.25%) Linux Command Line
3 6 (5.36%) Data Structures
4 5 (4.46%) Fixed Income
4 5 (4.46%) Hedge funds
4 5 (4.46%) Private Cloud
5 4 (3.57%) Algorithms
5 4 (3.57%) Data Centre
5 4 (3.57%) Reference Data
6 3 (2.68%) Equities
6 3 (2.68%) Hybrid Cloud
6 3 (2.68%) Product Ownership
7 2 (1.79%) Clustering
7 2 (1.79%) Reinsurance
7 2 (1.79%) Replication
7 2 (1.79%) Virtual Team
8 1 (0.89%) Renewable Energy
8 1 (0.89%) Self-Motivation
Operating Systems
1 34 (30.36%) Windows
2 32 (28.57%) Unix
3 7 (6.25%) Red Hat Enterprise Linux
4 4 (3.57%) Windows Server
5 3 (2.68%) AIX
5 3 (2.68%) Apple iOS
5 3 (2.68%) Mac OS
5 3 (2.68%) Oracle Linux
5 3 (2.68%) Rocky
6 2 (1.79%) CentOS
6 2 (1.79%) Solaris
6 2 (1.79%) SUSE
6 2 (1.79%) Windows 10
7 1 (0.89%) Android
7 1 (0.89%) Ubuntu
7 1 (0.89%) VMS
Processes & Methodologies
1 35 (31.25%) CI/CD
2 30 (26.79%) DevOps
3 25 (22.32%) Problem-Solving
4 22 (19.64%) Agile
5 17 (15.18%) Containerisation
6 13 (11.61%) Software Engineering
7 12 (10.71%) Continuous Integration
7 12 (10.71%) Electronic Trading
7 12 (10.71%) Infrastructure as Code
7 12 (10.71%) Low Latency
7 12 (10.71%) Migration
7 12 (10.71%) Test Automation
8 11 (9.82%) Configuration Management
8 11 (9.82%) Market Making
9 10 (8.93%) Algorithmic Trading
9 10 (8.93%) SDLC
10 9 (8.04%) Cloud Security
10 9 (8.04%) High Availability
11 8 (7.14%) Continuous Deployment
11 8 (7.14%) Scaled Agile Framework
Programming Languages
1 50 (44.64%) Python
2 33 (29.46%) Java
3 19 (16.96%) SQL
4 15 (13.39%) Bash
5 11 (9.82%) PowerShell
6 10 (8.93%) Shell Script
7 9 (8.04%) C++
8 8 (7.14%) C#
9 7 (6.25%) C
9 7 (6.25%) Go
9 7 (6.25%) Perl
9 7 (6.25%) Scala
10 6 (5.36%) JavaScript
11 3 (2.68%) TypeScript
12 2 (1.79%) Bicep
12 2 (1.79%) PROC SQL
12 2 (1.79%) SAS Macro
13 1 (0.89%) PL/SQL
13 1 (0.89%) Ruby
13 1 (0.89%) T-SQL
Qualifications
1 19 (16.96%) Security Cleared
2 18 (16.07%) SC Cleared
3 15 (13.39%) Degree
4 4 (3.57%) Azure Certification
5 3 (2.68%) Computer Science Degree
6 2 (1.79%) AWS Certification
6 2 (1.79%) AWS Certified Solutions Architect
6 2 (1.79%) CCNA
6 2 (1.79%) Cisco Certification
7 1 (0.89%) AWS Certified Developer
7 1 (0.89%) AWS Certified DevOps Engineer
7 1 (0.89%) AWS Certified SysOps Administrator
7 1 (0.89%) CCNP
7 1 (0.89%) CCSA
7 1 (0.89%) Master's Degree
7 1 (0.89%) RHCE
Quality Assurance & Compliance
1 8 (7.14%) GDPR
2 4 (3.57%) QA
3 2 (1.79%) Accessibility
3 2 (1.79%) SOC 2
4 1 (0.89%) Cyber Essentials
4 1 (0.89%) Data Quality
4 1 (0.89%) ISO/IEC 27001
4 1 (0.89%) NIST
4 1 (0.89%) Sarbanes-Oxley
System Software
1 18 (16.07%) Docker
2 7 (6.25%) Active Directory
3 5 (4.46%) VMware Infrastructure
4 3 (2.68%) VMware ESXi
5 2 (1.79%) Virtual Desktop
5 2 (1.79%) Virtual Machines
6 1 (0.89%) BitLocker
6 1 (0.89%) Firmware
6 1 (0.89%) NFS
6 1 (0.89%) Oracle RAC
6 1 (0.89%) Veritas File System
6 1 (0.89%) Veritas Volume Manager
Systems Management
1 22 (19.64%) Terraform
2 19 (16.96%) Kubernetes
3 18 (16.07%) Ansible
4 10 (8.93%) Grafana
4 10 (8.93%) Kibana
5 5 (4.46%) Progress Chef
5 5 (4.46%) Puppet
6 3 (2.68%) Consul
6 3 (2.68%) Control-M
6 3 (2.68%) Microsoft Intune
7 2 (1.79%) Podman
7 2 (1.79%) QRadar
7 2 (1.79%) Tivoli
8 1 (0.89%) Enterprise Manager Cloud Control
8 1 (0.89%) Istio
8 1 (0.89%) Prometheus
8 1 (0.89%) Rancher
8 1 (0.89%) Red Hat Satellite
8 1 (0.89%) SCOrch
8 1 (0.89%) Tivoli Storage Manager
Vendors
1 24 (21.43%) Microsoft
2 14 (12.50%) Oracle
3 7 (6.25%) Red Hat
4 5 (4.46%) VMware
5 4 (3.57%) CyberArk
5 4 (3.57%) Databricks
5 4 (3.57%) Google
5 4 (3.57%) Splunk
5 4 (3.57%) Sybase
6 3 (2.68%) Cisco
6 3 (2.68%) Citrix
6 3 (2.68%) IBM
7 2 (1.79%) Apple
7 2 (1.79%) BeyondTrust
7 2 (1.79%) BMC
7 2 (1.79%) EMC
7 2 (1.79%) Informatica
7 2 (1.79%) Planview
7 2 (1.79%) Qualys
7 2 (1.79%) Sage