JUnit Contracts in Glasgow

JUnit
Scotland > Glasgow

The table below provides summary statistics for contract job vacancies advertised in Glasgow requiring JUnit skills. It includes a benchmarking guide to the contractor rates offered in vacancies that cited JUnit over the 6 months leading up to 3 July 2025, comparing them to the same period in the previous two years.

6 months to
3 Jul 2025
Same period 2024 Same period 2023
Rank 32 62 71
Rank change year-on-year +30 +9 +6
Contract jobs citing JUnit 54 7 10
As % of all contract jobs advertised in Glasgow 6.84% 0.91% 1.11%
As % of the Development Applications category 27.27% 4.86% 6.54%
Number of daily rates quoted 26 5 8
10th Percentile £408 - £480
25th Percentile £430 - £497
Median daily rate (50th Percentile) £480 £500 £540
Median % change year-on-year -4.00% -7.41% +35.00%
75th Percentile £550 - £638
90th Percentile £575 - £670
Scotland median daily rate £490 £500 £540
% change year-on-year -2.00% -7.41% +20.00%

All Development Application Skills
Glasgow

JUnit falls under the Development Applications category. For comparison with the information above, the following table provides summary statistics for all contract job vacancies requiring development application skills in Glasgow.

Contract vacancies with a requirement for development application skills 198 144 153
As % of all contract IT jobs advertised in Glasgow 25.10% 18.75% 17.00%
Number of daily rates quoted 120 101 103
10th Percentile £312 £363 £343
25th Percentile £404 £410 £413
Median daily rate (50th Percentile) £464 £475 £500
Median % change year-on-year -2.37% -5.00% -2.44%
75th Percentile £538 £538 £588
90th Percentile £575 £588 £675
Scotland median daily rate £470 £477 £479
% change year-on-year -1.47% -0.42% +0.42%
Number of hourly rates quoted 7 8 3
10th Percentile £16.14 - £60.88
25th Percentile £16.84 - £61.37
Median hourly rate £17.45 £40.94 £64.38
Median % change year-on-year -57.39% -36.40% +49.71%
75th Percentile £18.05 - £67.66
90th Percentile £18.80 - £68.31
Scotland median hourly rate £17.45 £40.94 £60.55
% change year-on-year -57.39% -32.39% +11.10%

JUnit
Job Vacancy Trend in Glasgow

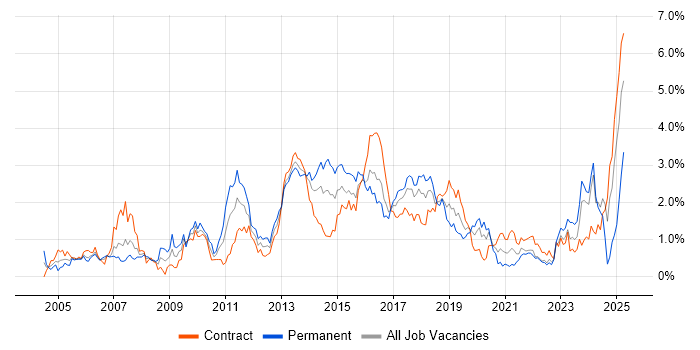
Job postings citing JUnit as a proportion of all IT jobs advertised in Glasgow.

Job vacancy trend for JUnit in Glasgow

JUnit
Contractor Daily Rate Trend in Glasgow

3-month moving average daily rate quoted in jobs citing JUnit in Glasgow.

Daily rate trend for JUnit in Glasgow

JUnit
Daily Rate Histogram in Glasgow

Daily rate distribution for jobs citing JUnit in Glasgow over the 6 months to 3 July 2025.

Daily rate histogram for JUnit in Glasgow

JUnit
Co-occurring Skills and Capabilities in Glasgow by Category

The follow tables expand on the table above by listing co-occurrences grouped by category. The same employment type, locality and period is covered with up to 20 co-occurrences shown in each of the following categories:

Cloud Services
1 8 (14.81%) Azure
1 8 (14.81%) BlazeMeter
2 7 (12.96%) AWS
3 3 (5.56%) Azure Cosmos DB
3 3 (5.56%) Azure DevOps
3 3 (5.56%) Azure Service Bus
3 3 (5.56%) GitHub
3 3 (5.56%) Serverless
3 3 (5.56%) Snowflake
4 2 (3.70%) GCP
5 1 (1.85%) OpenShift
Communications & Networking
1 1 (1.85%) HTTP
Database & Business Intelligence
1 41 (75.93%) MongoDB
2 37 (68.52%) Relational Database
3 36 (66.67%) DB2
4 10 (18.52%) NoSQL
4 10 (18.52%) RDBMS
5 8 (14.81%) Apache Cassandra
6 2 (3.70%) MySQL
6 2 (3.70%) PostgreSQL
7 1 (1.85%) Oracle Database
7 1 (1.85%) SQL Server
Development Applications
1 10 (18.52%) Mockito
2 5 (9.26%) GitLab
2 5 (9.26%) Jenkins
2 5 (9.26%) Maven
3 4 (7.41%) Git
4 2 (3.70%) Cucumber
4 2 (3.70%) Gradle
4 2 (3.70%) Sonatype Nexus
General
1 32 (59.26%) Finance
2 31 (57.41%) Social Skills
3 30 (55.56%) Analytical Skills
4 23 (42.59%) Front Office
5 18 (33.33%) Banking
6 15 (27.78%) Investment Banking
7 8 (14.81%) Inclusion and Diversity
8 3 (5.56%) Documentation Skills
8 3 (5.56%) Financial Institution
8 3 (5.56%) Presentation Skills
Job Titles
1 48 (88.89%) Developer
1 48 (88.89%) Java Developer
2 12 (22.22%) Investment Banking Java Developer
2 12 (22.22%) SQL Developer
2 12 (22.22%) Sybase Developer
3 6 (11.11%) Full-Stack Developer
3 6 (11.11%) Full-Stack Java Developer
4 4 (7.41%) Java Engineer
5 3 (5.56%) Full-Stack Engineer
5 3 (5.56%) React Developer
5 3 (5.56%) Senior
5 3 (5.56%) Senior Developer
5 3 (5.56%) Senior Java Developer
6 2 (3.70%) Core Java Developer
6 2 (3.70%) Lead
6 2 (3.70%) Lead Java Engineer
7 1 (1.85%) Azure Developer
7 1 (1.85%) Java Software Engineer
7 1 (1.85%) MongoDB Developer
7 1 (1.85%) Software Engineer
Libraries, Frameworks & Software Standards
1 51 (94.44%) Spring
2 38 (70.37%) Kafka
3 25 (46.30%) JMS
4 14 (25.93%) Spring Boot
5 11 (20.37%) React
6 9 (16.67%) AngularJS
6 9 (16.67%) CSS
7 5 (9.26%) Hibernate
8 3 (5.56%) RabbitMQ
8 3 (5.56%) RESTful
8 3 (5.56%) Spring Cloud
9 2 (3.70%) JAX-RS
9 2 (3.70%) JAX-WS
9 2 (3.70%) JPA
9 2 (3.70%) MSMQ
9 2 (3.70%) OAuth
9 2 (3.70%) REST
9 2 (3.70%) Spring MVC
10 1 (1.85%) HTML
10 1 (1.85%) J2EE
Miscellaneous
1 30 (55.56%) Data Structures
2 24 (44.44%) Equities
3 8 (14.81%) Algorithms
4 7 (12.96%) Equity Derivative
5 4 (7.41%) Derivative
6 1 (1.85%) Data Protection Act
6 1 (1.85%) Distributed Systems
Operating Systems
1 33 (61.11%) Linux
2 6 (11.11%) Unix
Processes & Methodologies
1 48 (88.89%) Agile
2 35 (64.81%) Problem-Solving
2 35 (64.81%) SDLC
3 28 (51.85%) Multithreading
4 27 (50.00%) Open Source
5 22 (40.74%) Database Tuning
5 22 (40.74%) Performance Tuning
6 21 (38.89%) Software Engineering
7 15 (27.78%) CI/CD
8 14 (25.93%) Microservices
9 13 (24.07%) Test Automation
10 11 (20.37%) Unit Testing
11 10 (18.52%) Community of Practice
11 10 (18.52%) Continuous Improvement
11 10 (18.52%) DevOps
11 10 (18.52%) Full-Stack Development
12 9 (16.67%) Front End Development
13 8 (14.81%) Continuous Delivery
13 8 (14.81%) Machine Learning
13 8 (14.81%) Performance Testing
Programming Languages
1 54 (100.00%) Java
2 42 (77.78%) SQL
3 31 (57.41%) Python
4 25 (46.30%) Shell Script
5 9 (16.67%) JavaScript
6 8 (14.81%) TypeScript
Quality Assurance & Compliance
1 5 (9.26%) Disclosure Scotland
2 2 (3.70%) QA
System Software
1 3 (5.56%) Docker
Systems Management
1 8 (14.81%) Grafana
2 6 (11.11%) Kubernetes
Vendors
1 33 (61.11%) Sybase
2 8 (14.81%) Dynatrace
2 8 (14.81%) Splunk
3 6 (11.11%) Oracle
4 4 (7.41%) IBM
5 1 (1.85%) Microsoft
5 1 (1.85%) ServiceNow