Azure Contracts in Glasgow

Microsoft Azure
Scotland > Glasgow

The table below provides summary statistics for contract job vacancies advertised in Glasgow requiring Azure skills. It includes a benchmarking guide to the contractor rates offered in vacancies that cited Azure over the 6 months leading up to 1 May 2025, comparing them to the same period in the previous two years.

6 months to
1 May 2025
Same period 2024 Same period 2023
Rank 13 14 10
Rank change year-on-year +1 -4 -2
Contract jobs citing Azure 123 105 134
As % of all contract jobs advertised in Glasgow 15.41% 11.97% 14.66%
As % of the Cloud Services category 40.07% 33.33% 41.61%
Number of daily rates quoted 89 87 80
10th Percentile £394 £359 £406
25th Percentile £419 £400 £456
Median daily rate (50th Percentile) £496 £475 £538
Median % change year-on-year +4.42% -11.75% +8.74%
75th Percentile £573 £575 £628
90th Percentile £690 £675 £700
Scotland median daily rate £475 £475 £510
% change year-on-year - -6.86% +7.37%
Number of hourly rates quoted 1 1 2
10th Percentile - - £56.68
25th Percentile £25.25 £51.25 £57.33
Median hourly rate £26.50 £52.50 £59.03
Median % change year-on-year -49.52% -11.05% -
75th Percentile £27.75 £53.75 £60.10
90th Percentile - - £60.37
Scotland median hourly rate £24.00 £17.72 £57.50
% change year-on-year +35.44% -69.18% +29.21%

All Cloud Skills
Glasgow

Azure falls under the Cloud Services category. For comparison with the information above, the following table provides summary statistics for all contract job vacancies requiring cloud computing skills in Glasgow.

Contract vacancies with a requirement for cloud computing skills 307 315 322
As % of all contract IT jobs advertised in Glasgow 38.47% 35.92% 35.23%
Number of daily rates quoted 213 231 230
10th Percentile £313 £213 £350
25th Percentile £400 £375 £410
Median daily rate (50th Percentile) £450 £467 £500
Median % change year-on-year -3.64% -6.60% +11.11%
75th Percentile £550 £538 £600
90th Percentile £600 £618 £676
Scotland median daily rate £466 £475 £475
% change year-on-year -1.89% - -
Number of hourly rates quoted 1 3 4
10th Percentile - - £23.28
25th Percentile £25.25 - £30.81
Median hourly rate £26.50 £15.42 £46.25
Median % change year-on-year +71.85% -66.66% +110.23%
75th Percentile £27.75 £34.59 £59.20
90th Percentile - £46.08 £60.01
Scotland median hourly rate £24.09 £17.00 £60.55
% change year-on-year +41.71% -71.92% +65.89%

Azure
Job Vacancy Trend in Glasgow

Job postings citing Azure as a proportion of all IT jobs advertised in Glasgow.
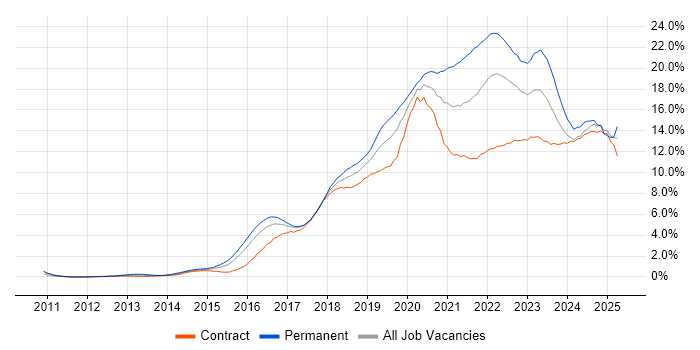
Job vacancy trend for Azure in Glasgow

Azure
Contractor Daily Rate Trend in Glasgow

3-month moving average daily rate quoted in jobs citing Azure in Glasgow.

Daily rate trend for Azure in Glasgow

Azure
Daily Rate Histogram in Glasgow

Daily rate distribution for jobs citing Azure in Glasgow over the 6 months to 1 May 2025.

Daily rate histogram for Azure in Glasgow

Azure
Contractor Hourly Rate Trend in Glasgow

3-month moving average hourly rates quoted in jobs citing Azure in Glasgow.

Hourly rate trend for Azure in Glasgow

Azure
Co-occurring Skills and Capabilities in Glasgow by Category

The follow tables expand on the table above by listing co-occurrences grouped by category. The same employment type, locality and period is covered with up to 20 co-occurrences shown in each of the following categories:

Application Platforms
1 11 (8.94%) SharePoint
2 5 (4.07%) Microsoft Exchange
3 2 (1.63%) JBoss
3 2 (1.63%) OpenROAD
4 1 (0.81%) Camunda
4 1 (0.81%) Confluence
4 1 (0.81%) SAS
Applications
1 7 (5.69%) Microsoft Office
2 4 (3.25%) Microsoft Excel
3 3 (2.44%) Microsoft Project
3 3 (2.44%) Sketch
4 1 (0.81%) Acrobat
4 1 (0.81%) Adobe Creative Suite
4 1 (0.81%) Adobe XD
4 1 (0.81%) Microsoft PowerPoint
4 1 (0.81%) MS Visio
Business Applications
1 2 (1.63%) Primavera
2 1 (0.81%) Dynamics CRM
Cloud Services
1 40 (32.52%) AWS
2 26 (21.14%) Azure DevOps
3 17 (13.82%) Cloud Computing
4 16 (13.01%) Entra ID
5 14 (11.38%) GitHub
6 12 (9.76%) OpenShift
7 11 (8.94%) Amazon S3
8 10 (8.13%) Microsoft 365
8 10 (8.13%) Power Platform
9 7 (5.69%) Azure Synapse Analytics
10 6 (4.88%) Azure Cosmos DB
10 6 (4.88%) Cohesity
10 6 (4.88%) Dynamics 365
10 6 (4.88%) GCP
10 6 (4.88%) SaaS
11 4 (3.25%) GitHub Actions
12 3 (2.44%) Azure Service Bus
12 3 (2.44%) OCI
12 3 (2.44%) Serverless
12 3 (2.44%) Snowflake
Communications & Networking
1 12 (9.76%) SAN
2 11 (8.94%) NAS
3 2 (1.63%) DHCP
3 2 (1.63%) DNS
3 2 (1.63%) TCP/IP
3 2 (1.63%) VPN
3 2 (1.63%) WAN
4 1 (0.81%) Cisco Firepower
4 1 (0.81%) Fibre Channel
4 1 (0.81%) Firewall
4 1 (0.81%) iSCSI
4 1 (0.81%) Network Security
4 1 (0.81%) Wireless
Database & Business Intelligence
1 10 (8.13%) SQL Server
2 7 (5.69%) DB2
2 7 (5.69%) MongoDB
3 5 (4.07%) Power BI
3 5 (4.07%) RDBMS
3 5 (4.07%) Relational Database
4 4 (3.25%) Data Lake
5 3 (2.44%) Data Warehouse
5 3 (2.44%) NoSQL
5 3 (2.44%) Oracle Exadata
6 1 (0.81%) Data Mining
6 1 (0.81%) Hadoop
6 1 (0.81%) MariaDB
6 1 (0.81%) MySQL
6 1 (0.81%) Neo4j
6 1 (0.81%) OLAP
6 1 (0.81%) Oracle Database
6 1 (0.81%) SQLite
Development Applications
1 21 (17.07%) Git
2 19 (15.45%) Jenkins
3 12 (9.76%) JIRA
4 6 (4.88%) JUnit
5 5 (4.07%) Bitbucket
6 4 (3.25%) GitLab
7 3 (2.44%) Mockito
8 1 (0.81%) Artifactory
8 1 (0.81%) GoCD
8 1 (0.81%) IntelliJ
8 1 (0.81%) PyCharm
8 1 (0.81%) SonarQube
8 1 (0.81%) Visual Studio
8 1 (0.81%) Visual Studio Code
General
1 49 (39.84%) Social Skills
2 32 (26.02%) Finance
3 30 (24.39%) Analytical Skills
4 20 (16.26%) Public Sector
5 13 (10.57%) Banking
6 5 (4.07%) Documentation Skills
6 5 (4.07%) Presentation Skills
7 4 (3.25%) Financial Institution
7 4 (3.25%) Investment Banking
7 4 (3.25%) Organisational Skills
8 3 (2.44%) Back Office
8 3 (2.44%) Influencing Skills
8 3 (2.44%) Legal
9 2 (1.63%) Front Office
10 1 (0.81%) Inclusion and Diversity
10 1 (0.81%) Pharmaceutical
10 1 (0.81%) Retail
10 1 (0.81%) Retail Banking
10 1 (0.81%) Retail Finance
Job Titles
1 26 (21.14%) Developer
2 24 (19.51%) Architect
3 22 (17.89%) Analyst
4 17 (13.82%) Solutions Architect
5 13 (10.57%) Senior
6 8 (6.50%) Azure Engineer
6 8 (6.50%) Data Engineer
6 8 (6.50%) Designer
6 8 (6.50%) Python Developer
7 6 (4.88%) Azure Data Engineer
7 6 (4.88%) Java Developer
7 6 (4.88%) Technical Analyst
8 5 (4.07%) Business Analyst
8 5 (4.07%) Infrastructure Engineer
8 5 (4.07%) Project Manager
8 5 (4.07%) Python Engineer
9 4 (3.25%) Data Architect
9 4 (3.25%) Senior Developer
10 3 (2.44%) Software Developer
10 3 (2.44%) Support Analyst
Libraries, Frameworks & Software Standards
1 8 (6.50%) Spring
2 7 (5.69%) Spring Boot
3 6 (4.88%) React
4 5 (4.07%) CSS
4 5 (4.07%) HTML
4 5 (4.07%) PySpark
5 4 (3.25%) AngularJS
5 4 (3.25%) Node.js
5 4 (3.25%) REST
6 3 (2.44%) Express.js
6 3 (2.44%) Hibernate
6 3 (2.44%) Kafka
6 3 (2.44%) Spring Cloud
7 2 (1.63%) .NET
7 2 (1.63%) FastAPI
7 2 (1.63%) Java SE
7 2 (1.63%) pytest
8 1 (0.81%) ASP.NET MVC 5
8 1 (0.81%) scikit-learn
8 1 (0.81%) Vue
Miscellaneous
1 7 (5.69%) Cloud Native
2 6 (4.88%) Distributed Systems
3 3 (2.44%) Clustering
3 3 (2.44%) Equity Derivative
3 3 (2.44%) Management Information System
3 3 (2.44%) Product Ownership
3 3 (2.44%) Public Cloud
3 3 (2.44%) Replication
3 3 (2.44%) Self-Motivation
4 2 (1.63%) Data Protection Act
4 2 (1.63%) Virtual Team
5 1 (0.81%) Analytical Mindset
5 1 (0.81%) CMDB
5 1 (0.81%) Data Centre
5 1 (0.81%) Enterprise Software
5 1 (0.81%) Hybrid Cloud
5 1 (0.81%) NVMe
5 1 (0.81%) Operational Technology
5 1 (0.81%) PKI
5 1 (0.81%) Security Posture
Operating Systems
1 30 (24.39%) Windows
2 25 (20.33%) Linux
3 24 (19.51%) Unix
4 15 (12.20%) Windows Server
5 6 (4.88%) Red Hat Enterprise Linux
6 5 (4.07%) AIX
7 3 (2.44%) Solaris
8 2 (1.63%) Android
8 2 (1.63%) Apple iOS
8 2 (1.63%) Mac OS
9 1 (0.81%) Data ONTAP
Processes & Methodologies
1 45 (36.59%) DevOps
2 43 (34.96%) Agile
3 38 (30.89%) Problem-Solving
4 32 (26.02%) CI/CD
5 13 (10.57%) Data Security
5 13 (10.57%) Decision-Making
5 13 (10.57%) SDLC
6 12 (9.76%) Cybersecurity
6 12 (9.76%) Data Protection
6 12 (9.76%) Software Engineering
6 12 (9.76%) Stakeholder Management
6 12 (9.76%) Test Automation
6 12 (9.76%) Waterfall
7 11 (8.94%) Data Deduplication
7 11 (8.94%) Observability
8 10 (8.13%) Data Transformation
8 10 (8.13%) Event-Driven
8 10 (8.13%) ITIL
9 9 (7.32%) Architectural Patterns
9 9 (7.32%) Enterprise Architecture
Programming Languages
1 34 (27.64%) Python
2 23 (18.70%) SQL
3 20 (16.26%) Java
4 11 (8.94%) TypeScript
5 8 (6.50%) JavaScript
6 7 (5.69%) C#
7 3 (2.44%) Shell Script
8 2 (1.63%) Bicep
9 1 (0.81%) C++
9 1 (0.81%) Go
9 1 (0.81%) Perl
9 1 (0.81%) PL/SQL
9 1 (0.81%) PowerShell
Qualifications
1 13 (10.57%) Degree
2 12 (9.76%) Azure Certification
3 10 (8.13%) AWS Certification
4 8 (6.50%) AWS Certified Solutions Architect
5 6 (4.88%) Microsoft Certification
6 3 (2.44%) Computer Science Degree
7 2 (1.63%) Master's Degree
8 1 (0.81%) (ISC)2 CCSP
8 1 (0.81%) BPSS Clearance
8 1 (0.81%) CCSP
8 1 (0.81%) Cisco Certification
8 1 (0.81%) CISM
8 1 (0.81%) CompTIA Security+
8 1 (0.81%) DBS Check
8 1 (0.81%) HNC
8 1 (0.81%) PMI Certification
8 1 (0.81%) PMP
8 1 (0.81%) SC Cleared
8 1 (0.81%) Security Cleared
8 1 (0.81%) TOGAF Certification
Quality Assurance & Compliance
1 4 (3.25%) Accessibility
1 4 (3.25%) Disclosure Scotland
1 4 (3.25%) GDPR
1 4 (3.25%) NIST
2 2 (1.63%) PMO
2 2 (1.63%) SLA
3 1 (0.81%) Data Quality
3 1 (0.81%) GRC
3 1 (0.81%) QA
System Software
1 16 (13.01%) Active Directory
2 6 (4.88%) Docker
3 4 (3.25%) RACF
4 3 (2.44%) Oracle RAC
4 3 (2.44%) Virtual Machines
4 3 (2.44%) VMware Infrastructure
5 2 (1.63%) Hyper-V
5 2 (1.63%) VMware ESXi
6 1 (0.81%) Firmware
6 1 (0.81%) GPFS
6 1 (0.81%) NFS
6 1 (0.81%) Virtual Desktop
Systems Management
1 23 (18.70%) Kubernetes
2 11 (8.94%) NetBackup
2 11 (8.94%) Oracle RMAN
3 10 (8.13%) Terraform
4 7 (5.69%) Ansible
4 7 (5.69%) Microsoft Intune
5 3 (2.44%) Data Guard
5 3 (2.44%) Failover Clustering
5 3 (2.44%) Microsoft Clustering
5 3 (2.44%) Oracle Enterprise Manager
5 3 (2.44%) Oracle Flashback
5 3 (2.44%) SCCM
6 2 (1.63%) Progress Chef
6 2 (1.63%) Puppet
6 2 (1.63%) Single Sign-On
7 1 (0.81%) Podman
7 1 (0.81%) RSA Archer
7 1 (0.81%) Veritas Storage Foundation
Vendors
1 24 (19.51%) Microsoft
2 15 (12.20%) Oracle
3 12 (9.76%) Veritas
4 8 (6.50%) CyberArk
5 6 (4.88%) VMware
6 5 (4.07%) Databricks
6 5 (4.07%) Red Hat
6 5 (4.07%) Sybase
7 4 (3.25%) IBM
8 3 (2.44%) Adobe
8 3 (2.44%) Dell
8 3 (2.44%) Dynatrace
8 3 (2.44%) ServiceNow
9 2 (1.63%) Autodesk
9 2 (1.63%) Google
10 1 (0.81%) Atlassian
10 1 (0.81%) Brocade
10 1 (0.81%) Pega
10 1 (0.81%) Proofpoint
10 1 (0.81%) Splunk